
Key Data Snapshot
| Metric | Value |
|---|---|
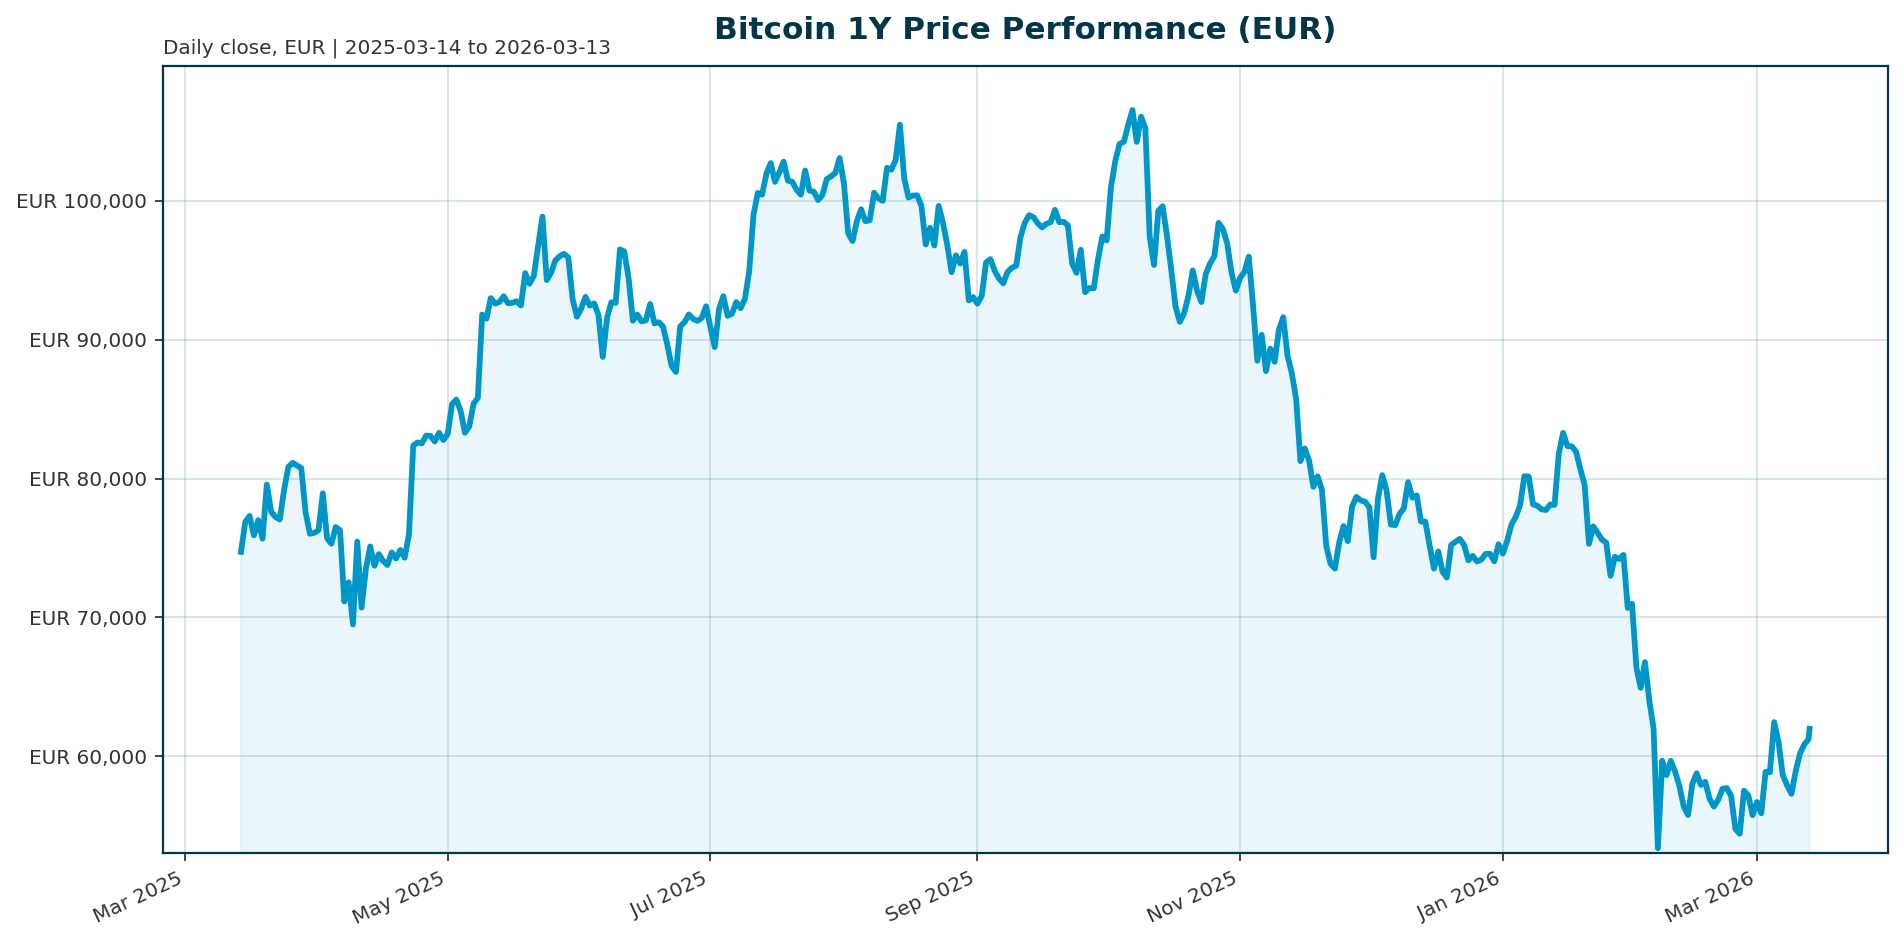
| Current Price (EUR) | 61,952.00 |
| 24h Change | +3.06% |
| Market Cap (EUR) | 1.24 Trillion |
| 24h Volume (EUR) | 41.23 Billion |
| All-Time High (ATH) | 107,662.00 (Oct 6, 2025) |
| ATH Drawdown | -42.46% |
| 200-Day Return | -35.69% |
| Crypto Fear & Greed Index | 8 (Extreme Fear) |
| Supply at Unrealized Loss | 43% |
| BTC Dominance | 56.88% |
Market Setup
Bitcoin trades in a volatile bear market recovery phase, currently priced at 61,952 EUR after a 42.5% drawdown from its October 2025 peak. The market structure remains fragile, evidenced by the Crypto Fear & Greed Index dropping to 8, returning to single digits after a period of stabilization attempts [T6]. On-chain metrics highlight significant stress, with approximately 43% of the circulating supply held at a loss, creating inherent selling pressure during short-term rallies [T7].
Liquidity conditions are tightening, posing a critical risk to the current fragile balance. A $1.2 billion liquidity squeeze at BlackRock, the largest ETF manager, signals a growing loss of conviction among institutional investors. This situation could trigger outflows from the IBIT BTC ETF, potentially sparking broader market uncertainty [T3]. Meanwhile, macro headwinds persist; rising oil prices linked to Middle East tensions are fueling inflation expectations, complicating the narrative around a timely Federal Reserve rate cut [T7]. Despite these risks, a rare divergence between Bitcoin and gold suggests Bitcoin may be oversold relative to safe-haven demand, presenting a potential contrarian setup if geopolitical risks ease [T2][T4].
Investment Thesis
The core investment thesis for Bitcoin centers on a transition from a speculative risk asset to a programmable digital utility. While current market behavior reinforces the speculative boom-and-bust cycle, institutional adoption is slowly maturing. However, the thesis faces significant headwinds as Digital Asset Treasury companies, which currently represent only about 10% of the total crypto market, may be forced to sell assets to meet debt servicing requirements during this downturn [T1]. This creates a vicious cycle where forced selling exacerbates price declines, hindering the transition to a stable store of value.
Conversely, the thesis is supported by the maturation of Bitcoin’s infrastructure. New initiatives, such as Ark Labs raising $5.2M backed by Tether to build programmable finance layers, aim to unlock Bitcoin’s utility beyond simple value transfer. These developments, combined with mining efficiency improvements that allow firms to hedge against fiat depreciation, suggest that the network’s fundamental value proposition is expanding even as price action remains choppy [T5][T8].
Bullish Drivers
Several catalysts could drive Bitcoin higher in the near term. First, the Bitcoin-to-gold ratio, measured by the Relative Strength Index (RSI), sits at historically low levels. This divergence suggests that gold may be temporarily overbought due to geopolitical tensions, while Bitcoin appears oversold. If geopolitical risks ease, capital flows could rotate back toward Bitcoin, providing a technical bounce [T2][T4].
Second, macroeconomic data offers a potential path to relief. The recent soft U.S. jobs report, which saw the unemployment rate rise to 4.2%, has raised expectations for a Federal Reserve pivot. While the Fed remains cautious, a delay in rate cuts has already weighed on risk assets; however, a confirmed pivot would be a strong bullish catalyst for Bitcoin [T7].
Third, infrastructure improvements are lowering the cost of production and increasing utility. Miners are adopting “light asset” models and securing long-term energy contracts to achieve self-sufficiency, while exchanges are executing large-scale treasury procurement plans to hedge against fiat devaluation [T8].
Relative Positioning vs Gold and Ethereum
Bitcoin currently underperforms gold in the short term, driven by safe-haven flows into traditional assets amidst Middle East tensions. The Bitcoin-to-gold ratio is at historically low levels, indicating that gold is currently absorbing risk-averse capital that Bitcoin cannot yet capture. However, this positioning implies that Bitcoin is technically oversold relative to its safe-haven peer. If geopolitical tensions subside and gold corrects, Bitcoin is positioned to reclaim relative strength [T2][T4].
Compared to Ethereum, Bitcoin maintains its dominance as the primary store of value within the crypto ecosystem. While Ethereum benefits from the broader DeFi and AI narratives, Bitcoin remains the benchmark asset. The total crypto market cap stands at 2.18 Trillion EUR, with Bitcoin capturing 56.88% of that value, reaffirming its status as the dominant digital asset class despite recent volatility [Market Data].
Scenario Framework
- Base Case (Consolidation): Bitcoin consolidates in a tight trading range between 60,000 and 70,000 EUR. The market awaits macro clarity on Fed policy and resolution of Middle East tensions. The Fear & Greed Index stabilizes around the 8-10 range, with volume remaining elevated but orderly.
- Bullish Case (Reversal): Bitcoin breaks resistance above 70,000 EUR, reclaiming the psychological level. This move is supported by a Fed rate cut, a correction in gold prices, and renewed institutional inflows. The 200-day moving average acts as support, and the supply at loss percentage begins to decline as holders stop selling.
- Bearish Case (Deep Drawdown): Bitcoin fails to hold 61,000 EUR, triggering a deeper sell-off toward 50,000 EUR. This scenario is driven by a liquidity crisis at major ETF providers like BlackRock, exacerbating forced sales from Digital Asset Treasuries. The Fear & Greed Index drops below 5, and the market enters a prolonged capitulation phase.
Valuation Discussion
Bitcoin is currently trading at a significant discount to its all-time high, down 42.46% from 107,662 EUR. The Fully Diluted Valuation (FDV) of 1.24 Trillion EUR aligns closely with the current Market Cap, suggesting the market has already priced in the scarcity of the 21 million coin cap. However, the 200-day return of -35.69% indicates that the asset is trading below its long-term moving average, suggesting it is undervalued on a technical basis relative to its historical performance.
The current valuation reflects the “risk-on” premium being stripped away. As the market transitions from the euphoria of the previous cycle to the utility-driven phase of the current cycle, the price-to-earnings (or price-to-utility) multiple may expand. If programmable finance layers (like Arkade) gain traction, the fundamental value of the network could increase, justifying a re-rating toward the ATH levels, provided liquidity conditions normalize.
Risks
The primary risk to the current thesis is a liquidity crunch in traditional finance. BlackRock’s recent 7.69% share drop and $1.2 billion liquidity squeeze highlight the fragility of the current market structure. If this trend continues, outflows from the IBIT ETF could cascade, forcing Digital Asset Treasuries to sell Bitcoin, potentially creating a self-fulfilling prophecy of lower prices [T3][T1].
A second major risk is the macroeconomic environment. The Fed may delay rate cuts longer than anticipated due to sticky inflation data, particularly from energy costs. Additionally, if Middle East tensions escalate, gold could strengthen further, suppressing Bitcoin’s relative performance and capital flows [T6][T7].
Appendix
- T1 Bitcoin price news: BTC in deep bear market, could crash by another 30%, investment firm says – CoinDesk
- T2 Bitcoin Price Fails at $74K as Rejection Raises Risk of a 17% Drop – Coinpaper
- T3 $1.2B liquidity warning – How BlackRock could ‘rock’ the crypto market – AMBCrypto
- T4 Bitcoin Fails at $74K and Analysts See a Risk of a Deeper Fall Toward $61K – CryptoRank
- T5 Ark Labs Raises $5.2M Backed by Tether to Build Programmable Finance on Bitcoin – markets.businessinsider.com
- T6 Bitcoin Is Suddenly Braced For A Surprise Fed Price Shock – Forbes
- T7 Bitcoin price news: BTC holds losses, trades near $70,000, after soft U.S. jobs data – CoinDesk
- T8 BBX: “AI Business Self-Sufficiency” and “Custody Sovereignty” —Bit Digital AI Accounts for Over 22%, Hut 8 Launches Asset-Light Siphoning – Bitget
This report is AI-generated, for informational purposes only, and not investment advice. The views expressed herein are those of the author and do not constitute financial, legal, or tax advice. Past performance is not indicative of future results. Readers should conduct their own due diligence before making investment decisions.
Important Note / Wichtiger Hinweis:
EN: This report may contain AI-assisted analysis or be generated entirely by AI, which processes market data from publicly available sources for which altii accepts no responsibility for its accuracy. We strongly advise against using this report as a basis for investment decisions.
DE: Dieser Bericht kann KI-gestützte Analysen enthalten oder vollständig von KI erstellt worden sein, die Marktdaten aus öffentlich zugänglichen Quellen verarbeitet, für deren Richtigkeit altii keine Verantwortung übernimmt. Wir raten dringend davon ab, diesen Bericht als Grundlage für Anlageentscheidungen zu verwenden.