
Key Data Snapshot
| Metric | Value |
|---|---|
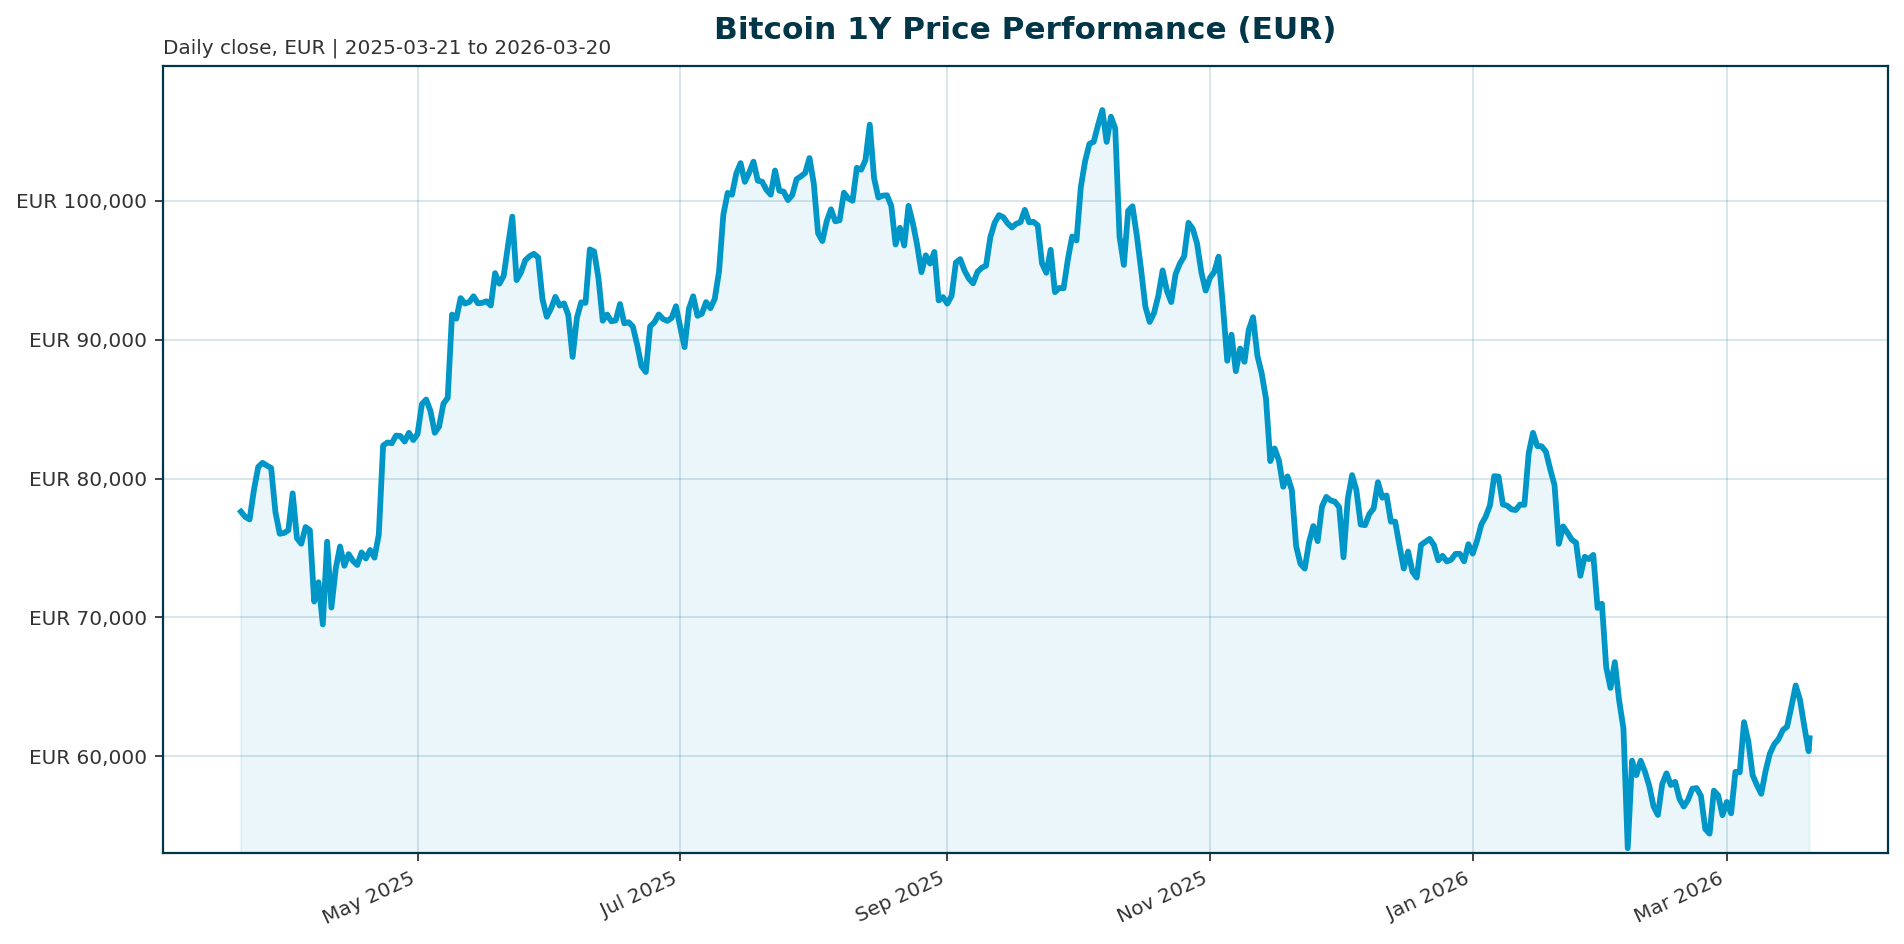
| Current Price (EUR) | €61,271.00 |
| Market Cap (EUR) | €1.22T |
| 24h Change | -0.86% |
| 7d Change | -1.20% |
| 30d Change | +7.06% |
| 200d Change | -33.35% |
| All-Time High (ATH) | |
| ATH Change | -43.09% |
| BTC Dominance | 56.54% |
Market Setup
Bitcoin is currently navigating a consolidation phase following a relief rally that tested the $75,000 resistance level. The asset is trading near €61,271, exhibiting a relief bounce supported by short squeezes and robust spot ETF inflows. Technical indicators suggest Bitcoin is beginning to decouple from its traditional correlation with technology stocks, as the IGV (iShares Expanded Tech Software ETF) trended lower while Bitcoin gained strength. However, derivatives positioning presents a risk, with a significant concentration of options open interest around the $75,000 strike, which could amplify volatility if breached. The market is currently in a wait-and-see mode ahead of critical macroeconomic data, including the Federal Reserve’s March 18 rate decision.
Investment Thesis
The prevailing thesis for Bitcoin has shifted from a pure “digital gold” safe haven narrative to a more nuanced “conditional hedge” and liquidity capture play. During the current geopolitical tensions involving Iran, Bitcoin outperformed traditional safe havens and tech stocks, gaining approximately 13% while gold fell around 6% and tech stocks rose only 3%. This performance suggests that investors are positioning Bitcoin not as a refuge during the shock itself, but as a beneficiary of the fiscal expansion and money printing that typically follows geopolitical crises. The asset’s 24/7 liquidity and accessibility make it a preferred instrument for tactical hedging during fast-moving global events, distinguishing it from markets that close during times of stress.
Bullish Drivers
Institutional spot demand has returned to the market, evidenced by consistent ETF net inflows and corporate treasury accumulation. U.S. spot bitcoin ETFs reported $767.3 million in net inflows last week, marking a third consecutive week of positive flows, and approximately $1.3 billion in net inflows so far in March, the first positive month since October. Corporate entities, such as Strategy, continue to accumulate BTC, purchasing 17,994 coins recently, which provides a fundamental floor for prices. Additionally, the weakening correlation with tech stocks suggests Bitcoin is attracting capital from broader risk assets, while the “digital gold” narrative is reinforced by the scarcity of the asset and the post-halving supply dynamics.
Relative Positioning vs Gold and Ethereum
Bitcoin currently holds a dominant market position with a 56.54% share of the total crypto market cap, yet it faces competition from Ethereum in terms of recent ETF flows. While BTC ETFs saw $767.3 million in inflows last week, Spot Ether ETFs recorded $160.8 million, suggesting ETH is currently leading in speculative flows. However, relative to traditional assets, Bitcoin has outperformed gold and U.S. equities during the current conflict. Gold has shed approximately $400 in value since the conflict began, whereas Bitcoin has surged nearly 10%, indicating a shift in investor preference toward liquid, high-beta assets over traditional safe havens.
Scenario Framework
Bullish Case: If the Federal Reserve cuts rates, oil prices stabilize, and ETF inflows sustain above $1 billion per week, Bitcoin could break the $75,000 resistance. A clean break above this level, supported by fiscal expansion tied to wartime spending, could trigger a rally toward $100,000, with potential targets reaching $150,000-$180,000 within 18-24 months.
Base Case: If the Fed maintains current rates and the geopolitical conflict remains contained, Bitcoin will likely consolidate within the €60,000 to €75,000 range. Market participants will await macro clarity to determine if the current liquidity-driven rally has structural legs.
Bearish Case: If the conflict escalates or the Fed maintains high rates, Bitcoin could lose its recent gains. A breakdown below the €60,000 support level could lead to a retest of the €50,000 mark, driven by tightening liquidity and renewed risk-off sentiment.
Valuation Discussion
Current valuation stands at €1.22 trillion, representing a 43% discount from the October 2025 all-time high. While this discount reflects the prolonged bear market correction, the total crypto market cap of €2.17T suggests room for upside if liquidity expands. The valuation argument is increasingly centered on Bitcoin’s role as a liquidity receiver rather than a yield generator. As fiscal deficits expand due to war spending, Bitcoin’s fixed supply cap allows it to capture a disproportionate share of new monetary base, potentially justifying a re-rating toward its previous highs if the macro environment aligns with the bullish scenario.
Risks
Structural Trust Deficit: Bitcoin lacks the institutional trust accumulated by gold over 5,000 years. During genuine fear events, fund managers still prefer gold over Bitcoin, categorizing it as a risk asset alongside technology stocks [T7].
Adoption Lag: ETF flows remain largely retail-driven, with Morgan Stanley noting that 80% of crypto ETF activity on its platform comes from self-directed accounts rather than advisor-managed portfolios. Slow advisor integration limits the scale of institutional allocation [T2].
Technical Volatility: The concentration of options open interest around the $75,000 strike creates a potential “wall” that could trigger a sharp reversal if breached. Additionally, macro tightening risks could suppress liquidity, undermining the current rally [T8].
Appendix
Sources
- Bitcoin rally tests $75,000 level in massive short squeeze – The Block [T1]
- Crypto ETF Demand Still Driven by Self-Directed Investors, Morgan Stanley Says – FinanceFeeds [T2]
- Bitcoin trades around $72,800 in ‘solid’ relief bounce supported by ETF inflows – The Block [T3]
- Not Gold, Not US Dollar, This Asset Has Surged The Most During Iran War – NDTV [T4]
- BTC price analysis: Bitcoin set for best week since September 2025 as correlation with tech stocks weakens – CoinDesk [T5]
- BTC price hits a wall at $75,000 while onchain energy markets run hot: Crypto Daybook Americas – CoinDesk [T6]
- Bitcoin In The Crossfire: What Oil Shocks Really Do To Crypto – Forbes [T7]
- Bitcoin Pushes Higher as Macro Tests Loom – Decrypt [T8]
This report is AI-generated for informational purposes only and does not constitute investment advice. The analysis is based on data available as of 2026-03-20 and should not be considered a recommendation to buy or sell any asset.
Important Note / Wichtiger Hinweis:
EN: This report may contain AI-assisted analysis or be generated entirely by AI, which processes market data from publicly available sources for which altii accepts no responsibility for its accuracy. We strongly advise against using this report as a basis for investment decisions.
DE: Dieser Bericht kann KI-gestützte Analysen enthalten oder vollständig von KI erstellt worden sein, die Marktdaten aus öffentlich zugänglichen Quellen verarbeitet, für deren Richtigkeit altii keine Verantwortung übernimmt. Wir raten dringend davon ab, diesen Bericht als Grundlage für Anlageentscheidungen zu verwenden.