
Key Data Snapshot
| Metric | Value |
|---|---|
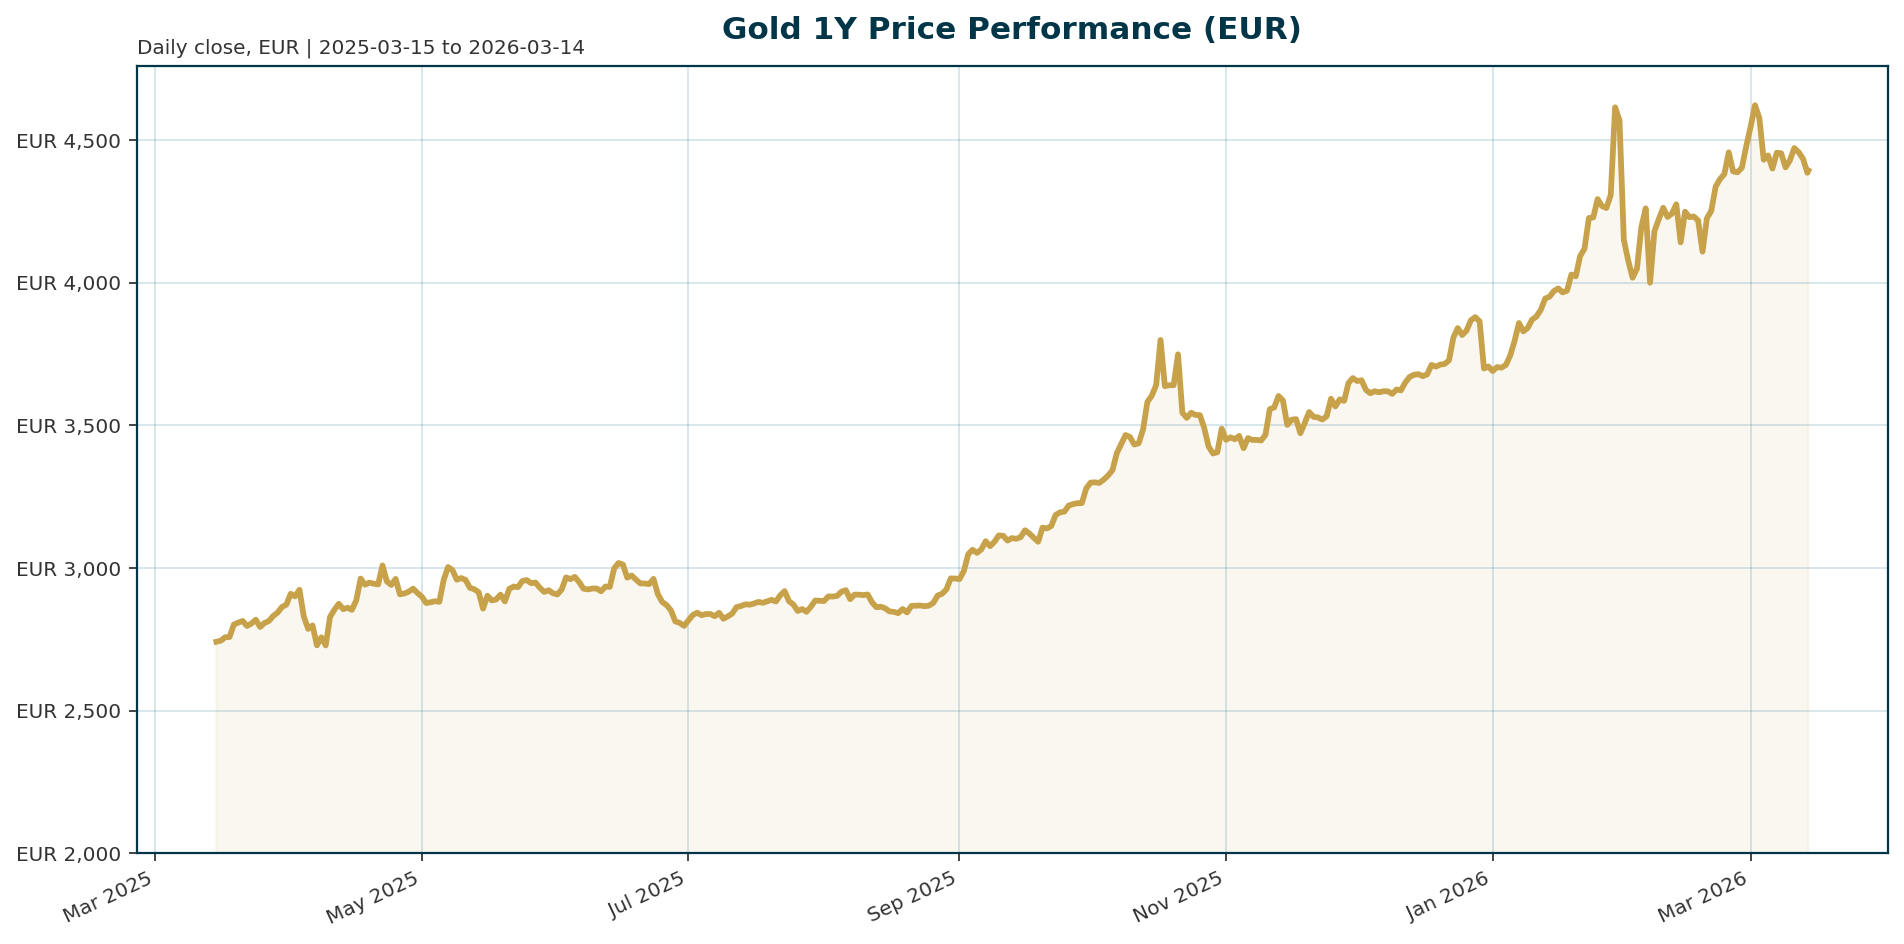
| Price (EUR) | 4,393.11 |
| 24h Change | -1.07% |
| 7d Change | -1.37% |
| 1m Change | +2.83% |
| YTD Change | +58.26% |
| 200d Change | +51.83% |
| All-Time High (ATH) | 4,688.32 EUR (Jan 29, 2026) |
| ATH Change | -6.29% |
| China Gold Reserves | 74.22M fine troy oz ($387.59B) [T4] |
| Chile Gold Reserves | $1.108B (Feb 2026) [T1] |
Macro Backdrop
The gold market operates in a complex “push-pull” dynamic defined by escalating geopolitical risk and persistent inflationary pressures. On the bullish side, the conflict between Iran and Israel has effectively shut the Strait of Hormuz, a critical energy chokepoint, intensifying fears of supply shocks and global instability [T2][T3][T5]. This environment drives safe-haven demand, with investors increasing exposure to the metal as a protection against financial stress [T2][T8]. However, the bearish counterweight is the surge in oil prices, which threaten to reignite inflation. The US CPI remains sticky at 2.4%, complicating the narrative for aggressive monetary easing [T3][T6]. Consequently, the Federal Reserve is expected to hold rates steady on March 18, while the prospect of “higher for longer” real yields weighs on the non-yielding asset [T2][T3].
Investment Thesis
The primary thesis for holding gold centers on portfolio diversification and protection against a potential stagflationary shock. As correlations between traditional assets like equities and bonds break down due to the war, the opportunity set for effective risk diversifiers has narrowed materially [T5]. Gold serves as a critical hedge when inflation expectations rise and traditional monetary policy loses efficacy. While the metal’s non-yielding nature makes it vulnerable to rising real yields, its historical reputation as a store of value becomes particularly pronounced during periods of economic uncertainty [T3][T6]. Investors are reallocating capital from bonds to gold, recognizing that the traditional 60/40 portfolio may fail to deliver without effective hedges [T5][T7].
Bullish Drivers
Structural support for gold prices is provided by aggressive central bank accumulation. China has expanded its gold reserves for a 16th consecutive month, reaching 74.22 million fine troy ounces, signaling a long-term strategic shift away from fiat currencies [T4]. Similarly, Chile’s Central Bank issued its first major gold purchase since at least 2000, adding a limited portion to reserves to improve risk diversification amid global turmoil [T1]. These actions provide a strong floor for prices. Additionally, the stalled fight against inflation at 2.4% reinforces the case for gold as a hedge, as the metal tends to hold value or appreciate when other assets falter during inflationary periods [T6].
Relative Positioning vs Bitcoin and Ethereum
While specific price data for Bitcoin and Ethereum is unavailable for quantitative comparison, the macro narrative suggests gold is currently favored over risk-on crypto assets. As correlations between traditional markets and cryptocurrencies shift due to geopolitical stress, gold is acting as the primary safe haven and diversifier [T5]. The current environment, characterized by war and inflation fears, favors capital preservation over speculative growth. Gold’s year-to-date performance of +58.26% indicates it is outperforming risk assets in this specific macro backdrop, positioning it as the safer allocation between the two.
Scenario Framework
- Bullish Scenario: Escalation of the Middle East conflict leads to a sustained oil price spike above $120. This fuels inflation above 3%, forcing the Fed to cut rates aggressively. Gold breaks its January 2026 ATH.
- Bearish Scenario: A peace deal or a rapid de-escalation of the conflict causes oil prices to crash. Inflation cools below 2%, allowing the Fed to maintain high rates. Real yields rise, causing gold to correct significantly from current levels.
- Base Case: The conflict enters a stalemate. Oil prices remain elevated but stabilize around current levels. Inflation stays sticky at 2.4%, and the Fed holds rates steady. Gold consolidates around current levels, trading 6% below its ATH.
Valuation Discussion
Gold is currently trading at 4,393.11 EUR, which places it 6.29% below its all-time high of 4,688.32 EUR established on January 29, 2026 [T1][T2]. Despite this pullback from the recent peak, the asset is in a robust secular uptrend, having gained 58.26% year-to-date. Valuation is supported less by technical indicators and more by fundamental demand from central banks and the ongoing need for portfolio insurance against global uncertainty [T1][T4]. The current discount to ATH offers a potential entry point for investors seeking to establish positions before a potential breakout.
Risks
- Real Yield Risk: If inflation remains sticky, central banks may be forced to keep interest rates higher for longer. This increases the opportunity cost of holding non-yielding gold, potentially triggering a sell-off [T3][T6].
- Currency Risk: A stronger US dollar, driven by safe-haven flows into USD assets, directly pressures the EUR price of gold, making it more expensive for European investors [T3].
- Geopolitical De-escalation: A sudden resolution to the conflict or a drop in oil prices could remove the safe-haven premium, leading to profit-taking and a sharp correction in prices [T8].
Appendix
Sources
- Chile Central Bank issues first gold purchase in decades amid global turmoil – Mining.com [T1]
- Gold holds steady as rising oil prices, inflation woes cap safe-haven demand – CNBC [T2]
- Gold eases as firmer dollar, lingering inflation concerns weigh – KITCO [T3]
- China’s central bank extends gold buying to 16th month – Mining.com [T4]
- Investors Hunt for Hedges as War Shatters Decades-Old Strategies – Yahoo Finance [T5]
- 3 traditional gold investing benefits that are especially timely this March – CBS News [T6]
- Big European investors bet against swings in ECB, Bank of England rate expectations – KITCO [T7]
- Gold set for weekly drop as oil price surge weighs on rate-cut hopes – CNBC [T8]
This report is AI-generated for informational purposes only and does not constitute investment advice. Always conduct your own research and consult with a qualified financial advisor before making investment decisions.
Important Note / Wichtiger Hinweis:
EN: This report may contain AI-assisted analysis or be generated entirely by AI, which processes market data from publicly available sources for which altii accepts no responsibility for its accuracy. We strongly advise against using this report as a basis for investment decisions.
DE: Dieser Bericht kann KI-gestützte Analysen enthalten oder vollständig von KI erstellt worden sein, die Marktdaten aus öffentlich zugänglichen Quellen verarbeitet, für deren Richtigkeit altii keine Verantwortung übernimmt. Wir raten dringend davon ab, diesen Bericht als Grundlage für Anlageentscheidungen zu verwenden.