Following a dramatic rebound for stock markets in the first quarter of 2019, Duncan Lamont, Head of Research and Analytics at Schroders, assesses how market valuations have been affected.
Those who were brave enough to fight the emotional urge to sell during the carnage in markets which brought 2018 to a close have been richly rewarded in the first few months of 2019.
Of the five markets in our regular analysis, even the worst of the bunch (Japan) returned almost 8% so far this year (as of 12 April).
The US was the best with a 13.9% gain, an almost mirror image of the 13.7% it lost in the fourth quarter of 2018 (although this also provides a useful reminder that, because of the way returns compound from one period to the next, a given gain will not be enough to offset a loss of the same magnitude – the return over this six month period was -1.7%). The UK, Europe and emerging markets have all risen close to 10% this year.
Valuations are one of the most powerful indicators of long term returns. Buy when markets are “cheap” and the odds are stacked in your favour. Buy when they are expensive and, although you won’t necessarily lose money, more things have to come right for you to come out on top.
We highlighted in our January update that a combination of robust earnings growth and falling markets had brought stock market valuations around the world close to their cheapest level for several years. Although short term risks were elevated, the longer term case had improved notably.
Although valuations are usually a poor guide to short term performance, markets have clearly rallied sharply from that nadir. However, the strength of performance in the early stages of 2019 means that returns, which were expected to have been earned over the medium to long term, have instead been harvested in barely three months.
This leaves less on the table for the future and the valuation case is now a lot more subdued. Simple models of expected returns linked to either dividend yields or earnings yields suggest that long term expected returns are around 0.3-0.4% lower in all markets than they were at the start of the year.
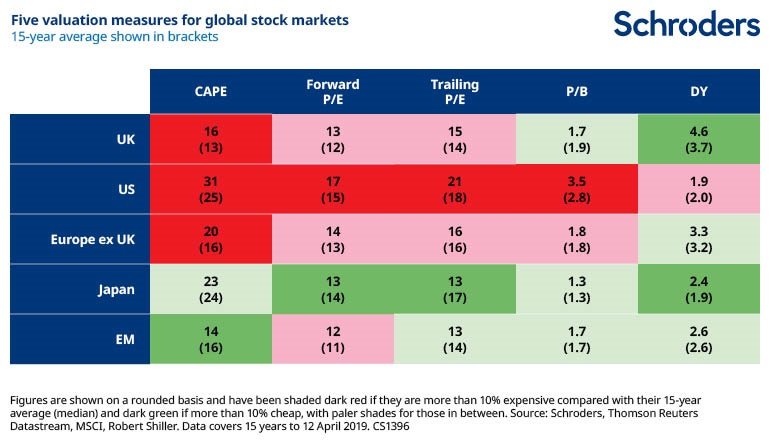
This more downbeat picture can be seen in our usual valuations table, which has more of a red hue than in January. However, a closer look at the numbers suggests a more nuanced stance is appropriate.
For non-US markets, those valuation indicators which are in expensive territory are pretty close to historic averages, with the exception of cyclically adjusted price to earnings (CAPE). A cautionary note but not something which should keep long term investors awake at night.
Bad performance could of course happen (a restarting of interest rate hikes in the US would be one possible driver) but valuations are unlikely to be the source of the problem. The US continues to be out on a limb. But betting against it has been a fool’s game for years and investors would be wise to maintain a balanced exposure to global stock markets.
Past Performance is not a guide to future performance and may not be repeated.
The pros and cons of stock market valuation measures
When considering stock market valuations, there are many different measures that investors can turn to. Each tells a different story. They all have their benefits and shortcomings so a rounded approach which takes into account their often-conflicting messages is the most likely to bear fruit.
Forward P/E
A common valuation measure is the forward price-to-earnings multiple or forward P/E. We divide a stock market’s value or price by the earnings per share of all the companies over the next 12 months. A low number represents better value.
An obvious drawback of this measure is that it is based on forecasts and no one knows what companies will earn in future. Analysts try to estimate this but frequently get it wrong, largely overestimating and making shares seem cheaper than they really are.
Trailing P/E
This is perhaps an even more common measure. It works similarly to forward P/E but takes the past 12 months’ earnings instead. In contrast to the forward P/E this involves no forecasting. However, the past 12 months may also give a misleading picture.
CAPE
The cyclically-adjusted price to earnings multiple is another key indicator followed by market watchers, and increasingly so in recent years. It is commonly known as CAPE for short or the Shiller P/E, in deference to the academic who first popularised it, Professor Robert Shiller.
This attempts to overcome the sensitivity that the trailing P/E has to the last 12 months’ earnings by instead comparing the price with average earnings over the past 10 years, with those profits adjusted for inflation. This smooths out short-term fluctuations in earnings.
When the Shiller P/E is high, subsequent long term returns are typically poor. One drawback is that it is a dreadful predictor of turning points in markets. The US has been expensively valued on this basis for many years but that has not been any hindrance to it becoming ever more expensive.
Price-to-book
The price-to-book multiple compares the price with the book value or net asset value of the stock market. A high value means a company is expensive relative to the value of assets expressed in its accounts. This could be because higher growth is expected in future.
A low value suggests that the market is valuing it at little more (or possibly even less, if the number is below one) than its accounting value. This link with the underlying asset value of the business is one reason why this approach has been popular with investors most focused on valuation, known as value investors.
However, for technology companies or companies in the services sector, which have little in the way of physical assets, it is largely meaningless. Also, differences in accounting standards can lead to significant variations around the world.
Dividend yield
The dividend yield, the income paid to investors as a percentage of the price, has been a useful tool to predict future returns. A low yield has been associated with poorer future returns.
However, while this measure still has some use, it has come unstuck over recent decades.
One reason is that “share buybacks” have become an increasingly popular means for companies to return cash to shareholders, as opposed to paying dividends (buying back shares helps push up the share price).
This trend has been most obvious in the US but has also been seen elsewhere. In addition, it fails to account for the large number of high-growth companies that either pay no dividend or a low dividend, instead preferring to re-invest surplus cash in the business to finance future growth.
A few general rules
Investors should beware the temptation to simply compare a valuation metric for one region with that of another. Differences in accounting standards and the makeup of different stock markets mean that some always trade on more expensive valuations than others.
For example, technology stocks are more expensive than some other sectors because of their relatively high growth prospects. A market with sizeable exposure to the technology sector, such as the US, will therefore trade on a more expensive valuation than somewhere like Europe. When assessing value across markets, we need to set a level playing field to overcome this issue.
One way to do this is to assess if each market is more expensive or cheaper than it has been historically.
We have done this in the table above for the valuation metrics set out above, however this information is not to be relied upon and should not be taken as a recommendation to buy/and or sell If you are unsure as to your investments speak to a financial adviser.
Finally, investors should always be mindful that past performance and historic market patterns are not a reliable guide to the future and that your money is at risk, as is this case with any investment.
This article has first been published on schroders.com.
* DE: Die ergänzenden Inhalte können KI-generiert sein. EN: The additional content may be AI-generated.