
Listen to the summary
Key Data Snapshot
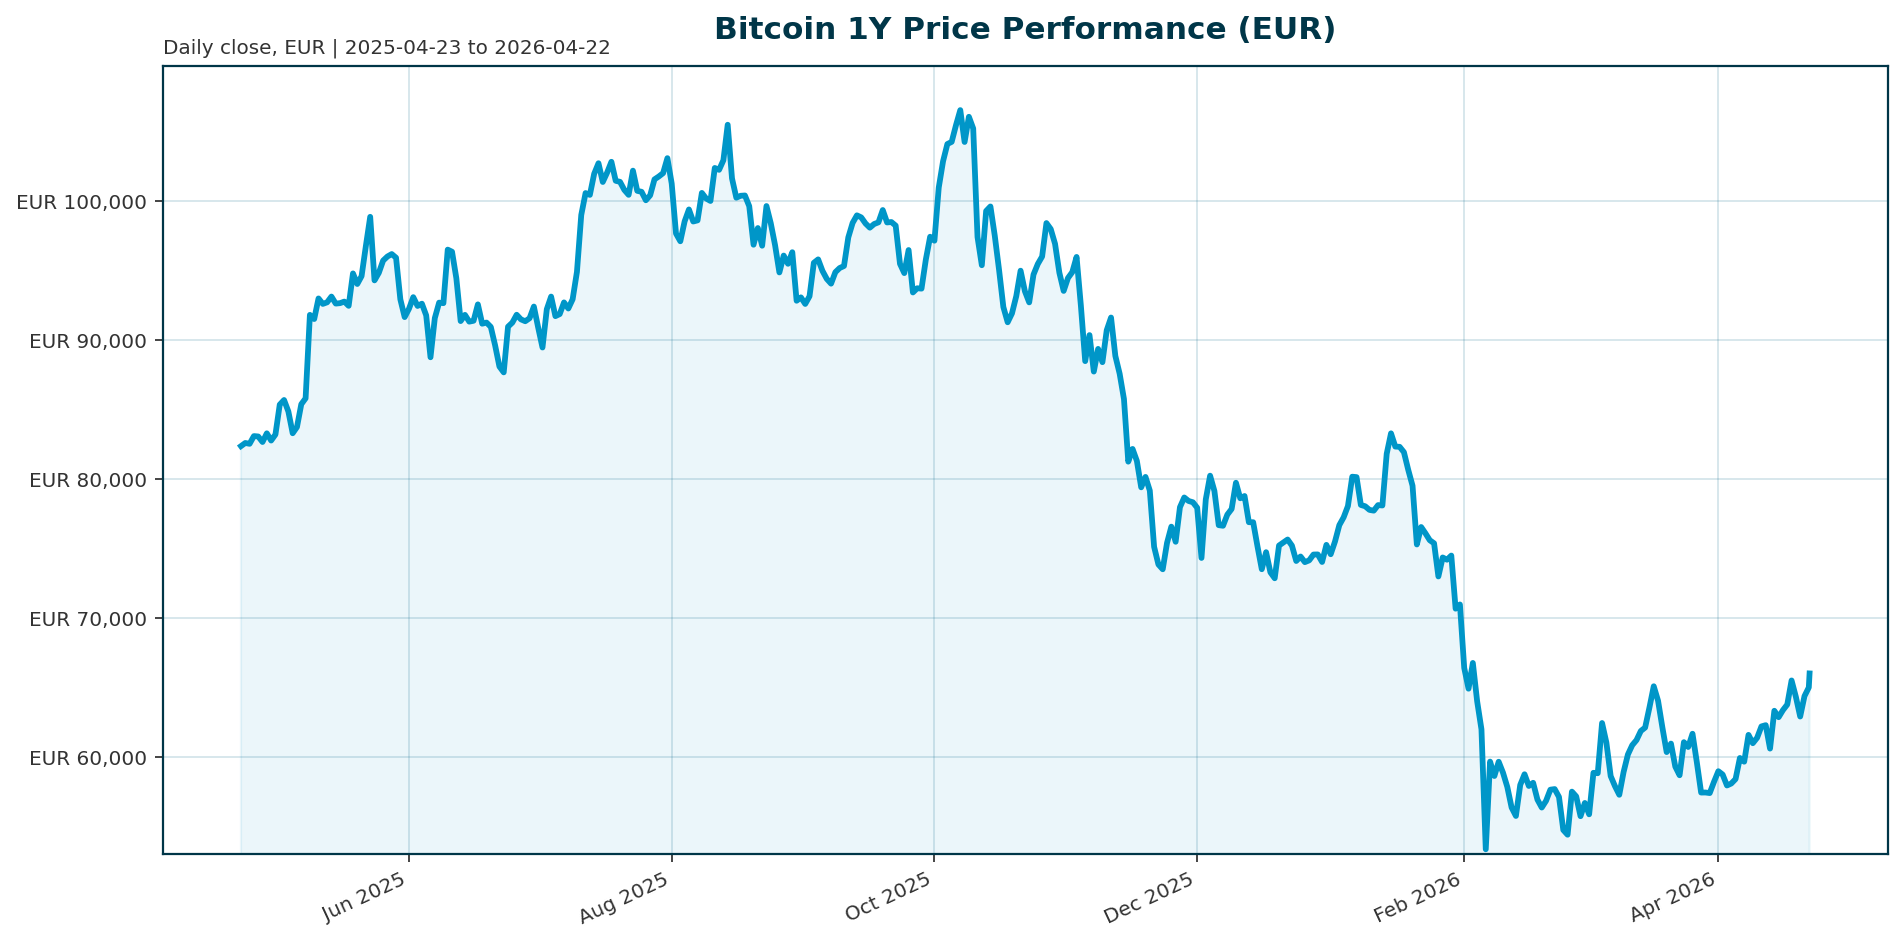
| Asset | Price (EUR) | Market Cap (EUR) | 24h Volume (EUR) | 24h Change | 1Y Change | ATH (EUR) | ATH Change | BTC Dominance |
|---|---|---|---|---|---|---|---|---|
| Bitcoin (BTC) | 66,044.00 | 1,322,429,553,292 | 37,624,255,876 | +2.77% | -13.72% | 107,662.00 | -38.66% | 57.87% |
Market Setup
Risk sentiment is positive while equity momentum is broadly positive with the Nasdaq Composite leading the charge. The Euro area rates backdrop is mixed with the 10-year yield at 3.04% and the 2-year yield at 2.42%. The FX backdrop is mixed, with EUR/USD at 1.1764. Key observations include Nasdaq leading on a 5-day basis at 1.02% and the Euro area 10-year yield moving -7.5 bp over 5 days. This environment supports Bitcoin as a risk-on asset, though it remains vulnerable to sharp corrections if macro headwinds intensify.Investment Thesis
Bitcoin operates on the thesis of digital scarcity and institutional integration. The asset is capped at 21 million coins, offering a fixed supply narrative that contrasts with inflationary fiat currencies. The primary thesis has evolved from speculative trading to earning a “seat at the asset allocation table” [T1]. Investors are betting on the continued assignment of value to a decentralized network rather than a traditional business model.Bullish Drivers
Institutional capital is actively deploying into Bitcoin, validating the thesis. BlackRock’s IBIT ETF led all funds with $612 million in inflows in a single week [T2], contributing to a total U.S. spot ETF AUM near $96.5 billion. New entrants are expanding the base, with Morgan Stanley’s MSBT attracting $116 million in its first week and Goldman Sachs filing for its first ETF product [T4]. Furthermore, more than $1 billion flowed into spot bitcoin ETFs in a single week this April, signaling a structural shift in capital flows [T1].Relative Positioning vs Gold and Ethereum
Bitcoin is increasingly behaving as a high-beta risk asset rather than a traditional safe haven. Unlike gold, which acts as a bunker during geopolitical terror, Bitcoin acts like a “tech stock that just got an NAD+ injection” [T8]. When markets face shocks, capital flees into physical metal immediately, whereas Bitcoin is subject to liquidation cascades. While Ethereum serves as a critical infrastructure layer, Bitcoin remains the primary store of value narrative for the digital asset class, currently commanding 57.87% dominance.Scenario Framework
Bullish Case: Sustained weekly inflows exceeding $1 billion combined with positive macro data could push Bitcoin towards $80,000. Polymarket traders currently price a 31% probability of BTC clearing $80,000 before the end of April [T2]. Base Case: Inflows stabilize around current levels, resulting in a consolidation phase between 60,000 and 70,000 EUR. Bearish Case: Outflows from legacy funds like Grayscale and Fidelity, combined with macro risk-off events such as the Iran conflict testing $71,000 support [T2], could lead to a retest of the 60,000 EUR support level.Valuation Discussion
The current valuation reflects the premium placed on institutional access. The fully diluted valuation sits at 1.322 trillion EUR, closely mirroring the market cap. The entry of major banks like Morgan Stanley and Goldman Sachs, with the latter filing for a product that could launch at the end of June [T4], suggests that the market is pricing in continued liquidity expansion. The low fee structure of new entrants, such as MSBT at 0.14% [T6], supports the sustainability of these inflows and justifies a premium valuation relative to previous cycles.Risks
Geopolitical Risk: Bitcoin faces immediate downside pressure from geopolitical instability. The asset tested $71,000 recently on Iran risk [T2], highlighting its sensitivity to global conflict. Regulatory Risk: In the United States, market structure legislation and stablecoin rules remain under debate, which could stall the pace of ETF inflows [T1]. Concentration Risk: The inflow narrative is heavily reliant on BlackRock’s IBIT, which has been doing most of the heavy lifting. If this concentration shifts, liquidity could dry up quickly.Appendix
Sources
- Asia Is Rewiring Finance As Institutions Move Onchain – Forbes [T1]
- ‘Mission Accomplished’—BlackRock Suddenly Bets $871M On Bitcoin Dip – Forbes [T2]
- Personal Conviction Outpaces Institutional Policy as Crypto Matures – The Fintech Times [T3]
- Goldman Sachs files for its first bitcoin ETF product – KITCO [T4]
- News Explorer — Ethereum NFT Art Platform Foundation Shuts Down After Sale Falls Through – Decrypt [T5]
- Morgan Stanley’s $116M Bitcoin ETF debut is tiny next to $1.9T, and that’s why Wall Street will notice – Bitget [T6]
- Bitcoin vs. Stocks: It’s time to stop pretending they’re the same – New York Post [T7]
- Beyond the memes: Understanding the unique roles of gold and Bitcoin – New York Post [T8]
This report is AI-generated for informational purposes only and does not constitute investment advice. The views expressed herein are those of the author and do not necessarily reflect the official policy or position of altii or any affiliated entities.
Important Note / Wichtiger Hinweis:
EN: This report may have been generated using AI. It processes data from publicly available sources. The content is provided for informational purposes only.DE: Dieser Bericht kann mithilfe von KI erstellt worden sein. Dabei werden Daten aus öffentlich zugänglichen Quellen verarbeitet. Die Inhalte dienen ausschließlich Informationszwecken.
* DE: Die ergänzenden Inhalte können KI-generiert sein. EN: The additional content may be AI-generated.