
Listen to the summary
Key Data Snapshot
| Metric | Value | Context |
|---|---|---|
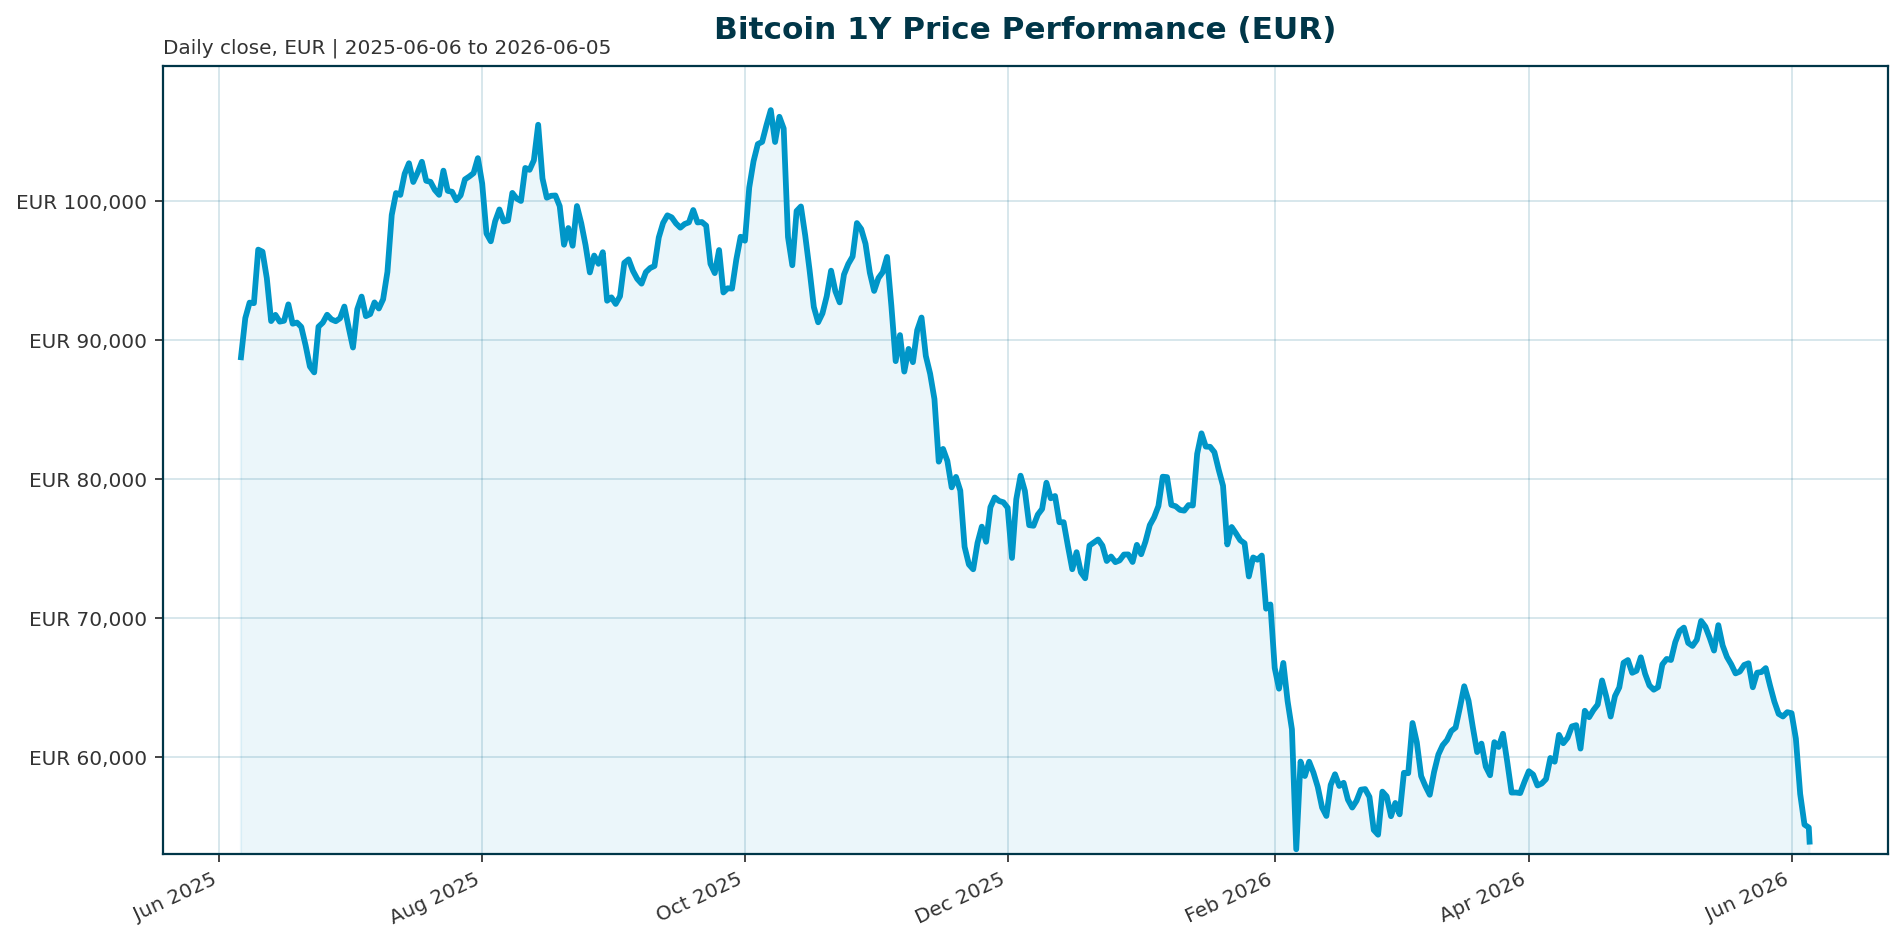
| Bitcoin Price (EUR) | 54,040.00 | Current spot price |
| All-Time High (ATH) | 107,662.00 | Oct 2025 | -49.8% |
| 1-Year Change | -41.3% | Significant drawdown from peak |
| 200-Day Change | -34.3% | Below long-term trend support |
| Market Cap | 1.08 Trillion EUR | #1 rank, 55.76% dominance |
| 24h Volume | 44.59 Billion EUR | Liquidity remains high |
Market Setup
The macro backdrop is characterized by a divergence between traditional risk assets and Bitcoin. Risk sentiment remains neutral to positive as equity indices, particularly the Nasdaq and S&P 500, continue hitting fresh highs driven by AI productivity narratives [T6]. The Euro area AAA 10Y yield sits at 3.06%, with the 10Y-2Y spread at 47.2 bp, indicating a complex rates environment where financing costs are elevated but not derailing the broader equity rally [T1][T6]. The Euro Stoxx 50 has shown strength with a 5-day gain of 0.87%, while the Hang Seng lags with a -1.48% decline, highlighting regional capital rotation [T1]. This environment has created a stark contrast where Bitcoin is trailing the Nasdaq-100 by the widest margin since 2019, losing the competition for incremental speculative capital to AI infrastructure and tech equities [T6].
Investment Thesis
The investment thesis for Bitcoin remains anchored on its structural role as a digital store of value and a hedge against fiscal debasement. Despite current headwinds, the asset is maturing from a purely speculative vehicle to one increasingly priced by ETFs, public company balance sheets, and macro trading capital [T2]. The primary thesis posits that the current drawdown is a liquidity event driven by regulatory uncertainty and capital rotation, rather than a failure of the underlying protocol. While the CLARITY Act prospects have drifted further out of reach, the long-term case for institutional allocation persists, contingent on the eventual resolution of regulatory frameworks and a return of capital to the crypto asset class [T1].
Bullish Drivers
Several catalysts could drive a reversal in the current downtrend. The most significant potential driver is a breakthrough in regulatory clarity via the CLARITY Act, which would unlock vast institutional capital currently on the sidelines [T1]. A rotation out of overvalued AI and tech equities back into undervalued Bitcoin could also trigger a re-rating, as the asset currently offers a deep discount to its ATH [T6]. Additionally, continued corporate treasury accumulation by firms like Strategy provides a fundamental floor, while fears around fiscal position and monetary debasement remain a persistent tailwind for the ‘de-basement trade’ narrative [T1].
Relative Positioning vs Gold and Ethereum
Direct price comparison data for Ethereum (ETH) and Gold (XAU) is unavailable in the current dataset. However, the market structure suggests a rotation within the crypto sector. While Bitcoin ETFs are facing record outflows, Solana ETFs recorded $115 million of inflows in May, the highest monthly figure in 2026, indicating capital is moving within crypto, likely away from Bitcoin toward other narratives [T2]. In a traditional safe-haven context, Gold is currently outperforming as a traditional store of value, while Bitcoin remains decoupled from risk assets due to its correlation with tech equities rather than gold [T6].
Scenario Framework
- Base Case (Choppy Summer): ETF outflows moderate to approximately $100 million daily. Bitcoin consolidates between 50,000 and 60,000 EUR, failing to reclaim the 200-day moving average as leverage in perpetual futures markets builds [T3].
- Bear Case (Liquidity Crunch): Outflows exceed $500 million daily, extending the record streak. Bitcoin tests February lows around 55,000 EUR as corporate selling pressure from Strategy and Hive Digital intensifies [T1][T5].
- Bull Case (Regulatory Relief): The CLARITY Act passes or positive macro news emerges. ETF inflows resume above $200 million daily. Bitcoin rallies to reclaim the 200-day MA and potentially challenge the 70,000 EUR level [T1][T3].
Valuation Discussion
Bitcoin is currently trading at a significant discount to its historical peak, sitting at approximately 0.5x its All-Time High. This valuation reflects a severe contraction in market sentiment and the dominance of ETF outflows over on-chain fundamentals. The market is currently pricing Bitcoin as a liquid equity proxy rather than a scarce digital asset, making it highly sensitive to traditional financial variables such as interest rates and institutional flows [T2][T6].
Risks
The primary risks to the downside are the record-breaking ETF outflows, which have reached a 13-day streak and total assets under management have fallen to $82.8 billion, a 23% decline from mid-May [T1]. Corporate selling pressure has re-entered the market, highlighted by Strategy’s first BTC sale since 2022 and Hive Digital’s sale of 331 BTC in Q1 [T1][T5]. Furthermore, the Coinbase Premium Index is deeply negative at -100, indicating weak demand from U.S. institutional investors, while the Crypto Fear & Greed Index remains in the ‘Fear’ territory [T4].
Appendix
Sources
- Bitcoin is weathering its ugliest week in months as narrative fades and liquidity rotates – CNBC [T1]
- Bitcoin falls below $68,000 as bitcoin ETFs hit record losing streak – Sherwood News [T2]
- Bitcoin price news: BTC appears set for re-test of February’s lows as AI boom draws flood of capital – CoinDesk [T3]
- Bitcoin price analysis: BTC could have further room to fall, based on derivatives positioning – CoinDesk [T4]
- Data: Hive Digital sold 331 BTC in the first quarter, reducing its holdings to 150 BTC – WEEX [T5]
- Bitcoin trails stocks by most since 2019 as traders get their kicks elsewhere – CNBC [T6]
- Strategy leads crypto stocks lower after selling bitcoin – CNBC [T7]
- Tech is flashing a warning sign last seen in 2020. Strategist Larry McDonald sees a massive rotation coming. – MarketWatch [T8]
This report is AI-generated for informational purposes only and does not constitute investment advice. The views expressed are those of the AI assistant and do not reflect the official positions of Venice.ai or its developers.
Important Note / Wichtiger Hinweis:
EN: This report may have been generated using AI. It processes data from publicly available sources. The content is provided for informational purposes only.DE: Dieser Bericht kann mithilfe von KI erstellt worden sein. Dabei werden Daten aus öffentlich zugänglichen Quellen verarbeitet. Die Inhalte dienen ausschließlich Informationszwecken.
* DE: Die ergänzenden Inhalte können KI-generiert sein. EN: The additional content may be AI-generated.