
Listen to the summary
Key Data Snapshot
| Metric | Value | Change / Context |
|---|---|---|
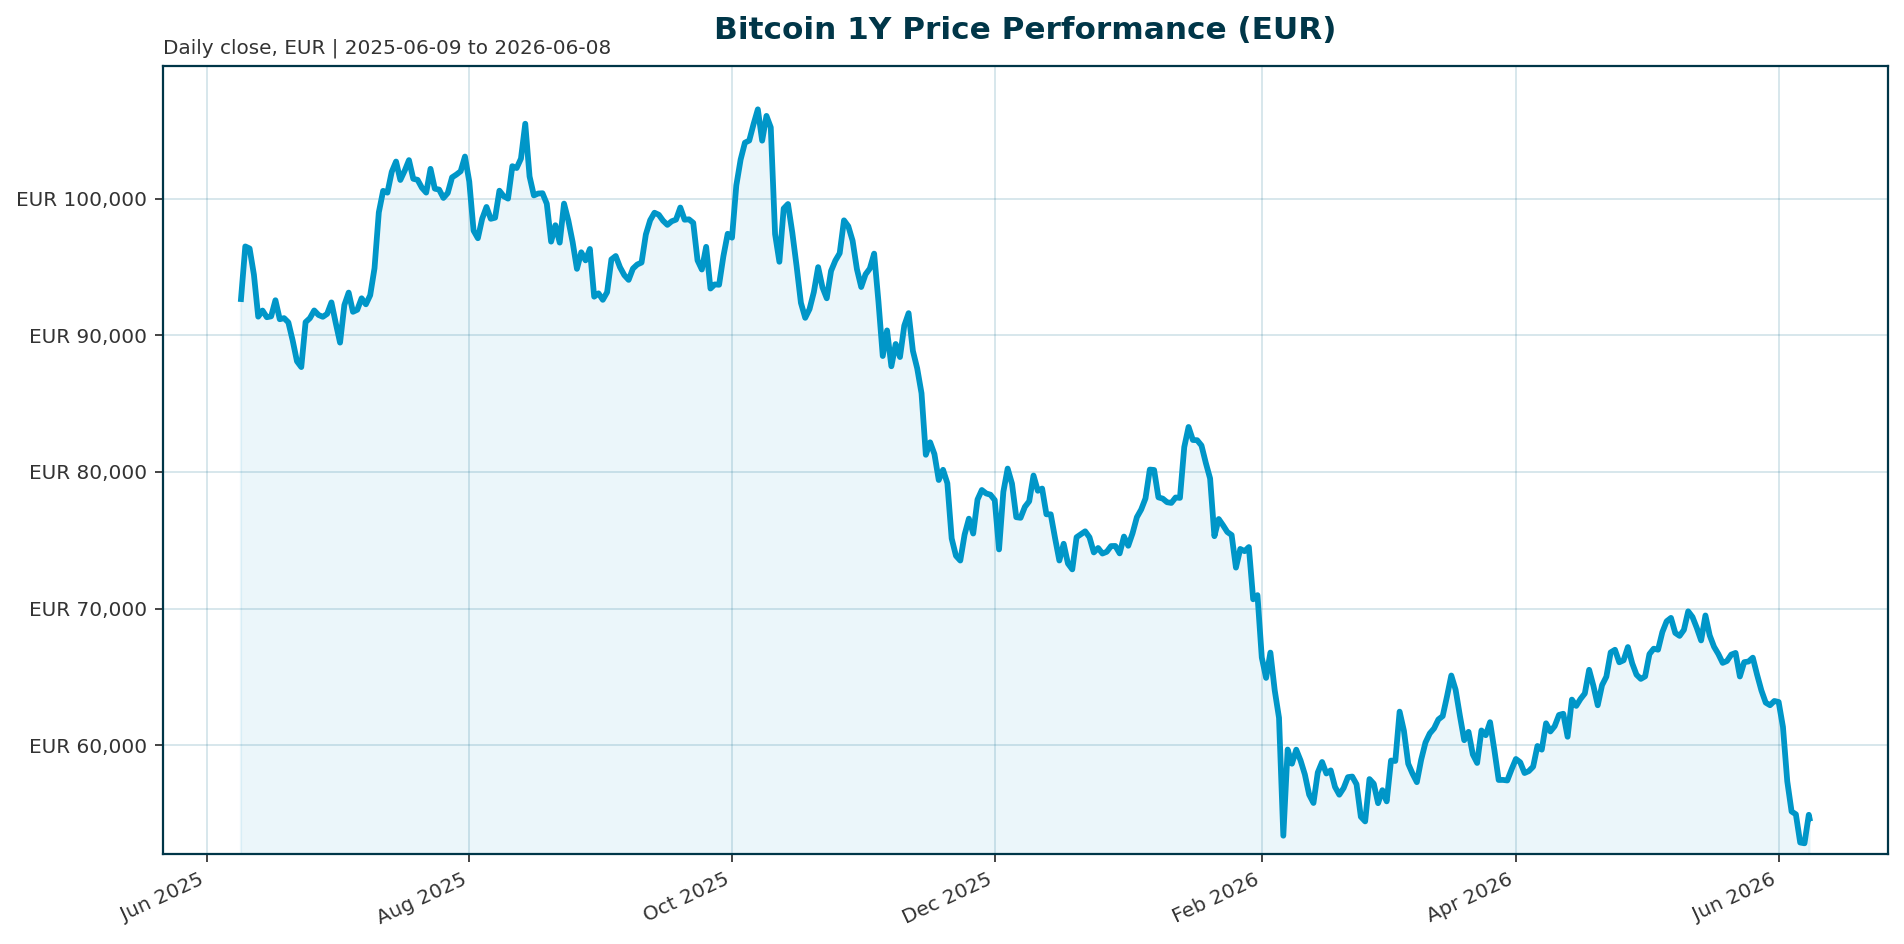
| Bitcoin Price (EUR) | 54,575.00 | +2.09% (24h) |
| Market Cap | 1.09T EUR | Rank 1 |
| 7-Day Change | -13.74% | Worst week since Feb |
| 1-Year Change | -41.05% | Down 49.3% from ATH |
| ATH Price | 107,662 EUR | Oct 2025 |
| ETF AUM | 82.8B USD | Down from 107.8B (May 14) |
| BTC Dominance | 56.11% | Down from 63% YoY |
Market Setup
Risk sentiment is neutral to negative. The Euro area 10Y yield sits at 3.07% with a mixed backdrop, while FX markets show EUR/USD at 1.1613. Key observations include the Euro Stoxx 50 leading on a 5-day basis at 0.45% while the Hang Seng lags at -5.36%. The DACH region is outperforming global equities with an average 5-day move of -0.42% versus -4.27% for global indicators. The primary macro backdrop is the aggressive rotation of capital away from crypto and into high-beta AI infrastructure and semiconductor stocks.Investment Thesis
The core thesis is “Capital Rotation.” Bitcoin has lost its status as the dominant momentum trade, with capital moving aggressively into AI infrastructure and SpaceX IPOs [T7]. ETF outflows are the primary driver of price action, explaining approximately 45% of weekly return variation, and serve as the best vehicle for tracking investor appetite [T1]. While institutional adoption metrics remain positive, the asset class is currently suffering from retail exhaustion and seasonal weakness, as investors chase hotter narratives rather than accumulating on dips.Bullish Drivers
- Institutional Backbone: Despite outflows, ETFs remain the primary tracking mechanism for adoption. Saylor’s Strategy holds 843,706 BTC, acting as a de facto stabilizer and signaling long-term conviction [T4].
- Regulatory Clarity: Progress on market structure bills, such as the CLARITY Act, continues to advance, providing a long-term floor for the asset class [T2].
- Valuation: Bitcoin is currently in a severely oversold position within its long-term trend, offering a potential entry point for value-oriented investors [T6].
Relative Positioning vs Gold and Ethereum
Bitcoin is losing ground to both traditional safe havens and alternative digital assets. BTC dominance has fallen from 63% to 56.11% [T7]. Stablecoins now account for almost 13% of the market versus roughly 7% a year ago, capturing volume that was previously part of the crypto ecosystem [T7]. Ethereum market share has remained roughly steady. Furthermore, Bitcoin trails the Nasdaq-100 by the widest margin since 2019, with a 70-percentage-point gap in favor of stocks over the last year [T8].Scenario Framework
- Base Case (Choppy Summer): Price tests February lows around €60,000. ETF outflows persist but slow as liquidity dries up. The market remains range-bound until the AI rotation cools.
- Bull Case (Regulatory Relief): The CLARITY Act passes, triggering a “buy the rumor” rally. ETF inflows resume, and capital rotates back into crypto as a hedge against AI concentration risk.
- Bear Case (Liquidity Squeeze): Macro uncertainty or further Saylor sales trigger forced liquidations. Price breaks below February lows, potentially testing the €50,000 psychological level.
Valuation Discussion
The current price of €54,575 represents a 49.3% discount to the October 2025 ATH of €107,662. While this suggests a deep correction, valuation is currently secondary to liquidity flows. The market is pricing in a significant probability of further downside, evidenced by the Coinbase Premium Index at -100 and the Crypto Fear & Greed Index signaling fear [T5]. The “discount” is widening as the asset class loses its narrative leadership to AI and semiconductor stocks.Risks
- Liquidity Rotation: The most immediate risk is the continued outflow of capital into AI and megacap IPOs. Without a catalyst to reverse this rotation, BTC will remain a lagging asset [T7].
- Sentiment Breakdown: The Coinbase Premium Index at -100 indicates extreme weakness in U.S. institutional demand [T5]. If this sentiment persists, it could lead to a “broken” asset narrative.
- Regulatory Gridlock: The CLARITY Act is drifting further out of reach as legislative priorities shift, removing a key catalyst for renewed investor interest [T1].
Appendix
Sources
- Bitcoin is weathering its ugliest week in months as narrative fades and liquidity rotates – CNBC [T1]
- Bitcoin isn’t crashing because of Saylor, it’s losing the momentum trade – CoinDesk [T2]
- Data: Hive Digital sold 331 BTC in the first quarter, reducing its holdings to 150 BTC – WEEX [T3]
- Bitcoin (BTC) isn’t broken, says Strategy’s (MSTR) Saylor – CoinDesk [T4]
- Bitcoin price analysis: BTC could have further room to fall, based on derivatives positioning – CoinDesk [T5]
- Bitcoin price news: BTC appears set for re-test of February’s lows as AI boom draws flood of capital – CoinDesk [T6]
- Bitcoin’s star fades, as investors flock to lustre of AI and megacap IPOs – Reuters [T7]
- Bitcoin trails stocks by most since 2019 as traders get their kicks elsewhere – CNBC [T8]
This report is AI-generated for informational purposes only and does not constitute investment advice. Readers should conduct their own due diligence before making investment decisions.
Important Note / Wichtiger Hinweis:
EN: This report may have been generated using AI. It processes data from publicly available sources. The content is provided for informational purposes only.DE: Dieser Bericht kann mithilfe von KI erstellt worden sein. Dabei werden Daten aus öffentlich zugänglichen Quellen verarbeitet. Die Inhalte dienen ausschließlich Informationszwecken.
* DE: Die ergänzenden Inhalte können KI-generiert sein. EN: The additional content may be AI-generated.