
Listen to the summary
Key Data Snapshot
| Metric | Value | Context |
|---|---|---|
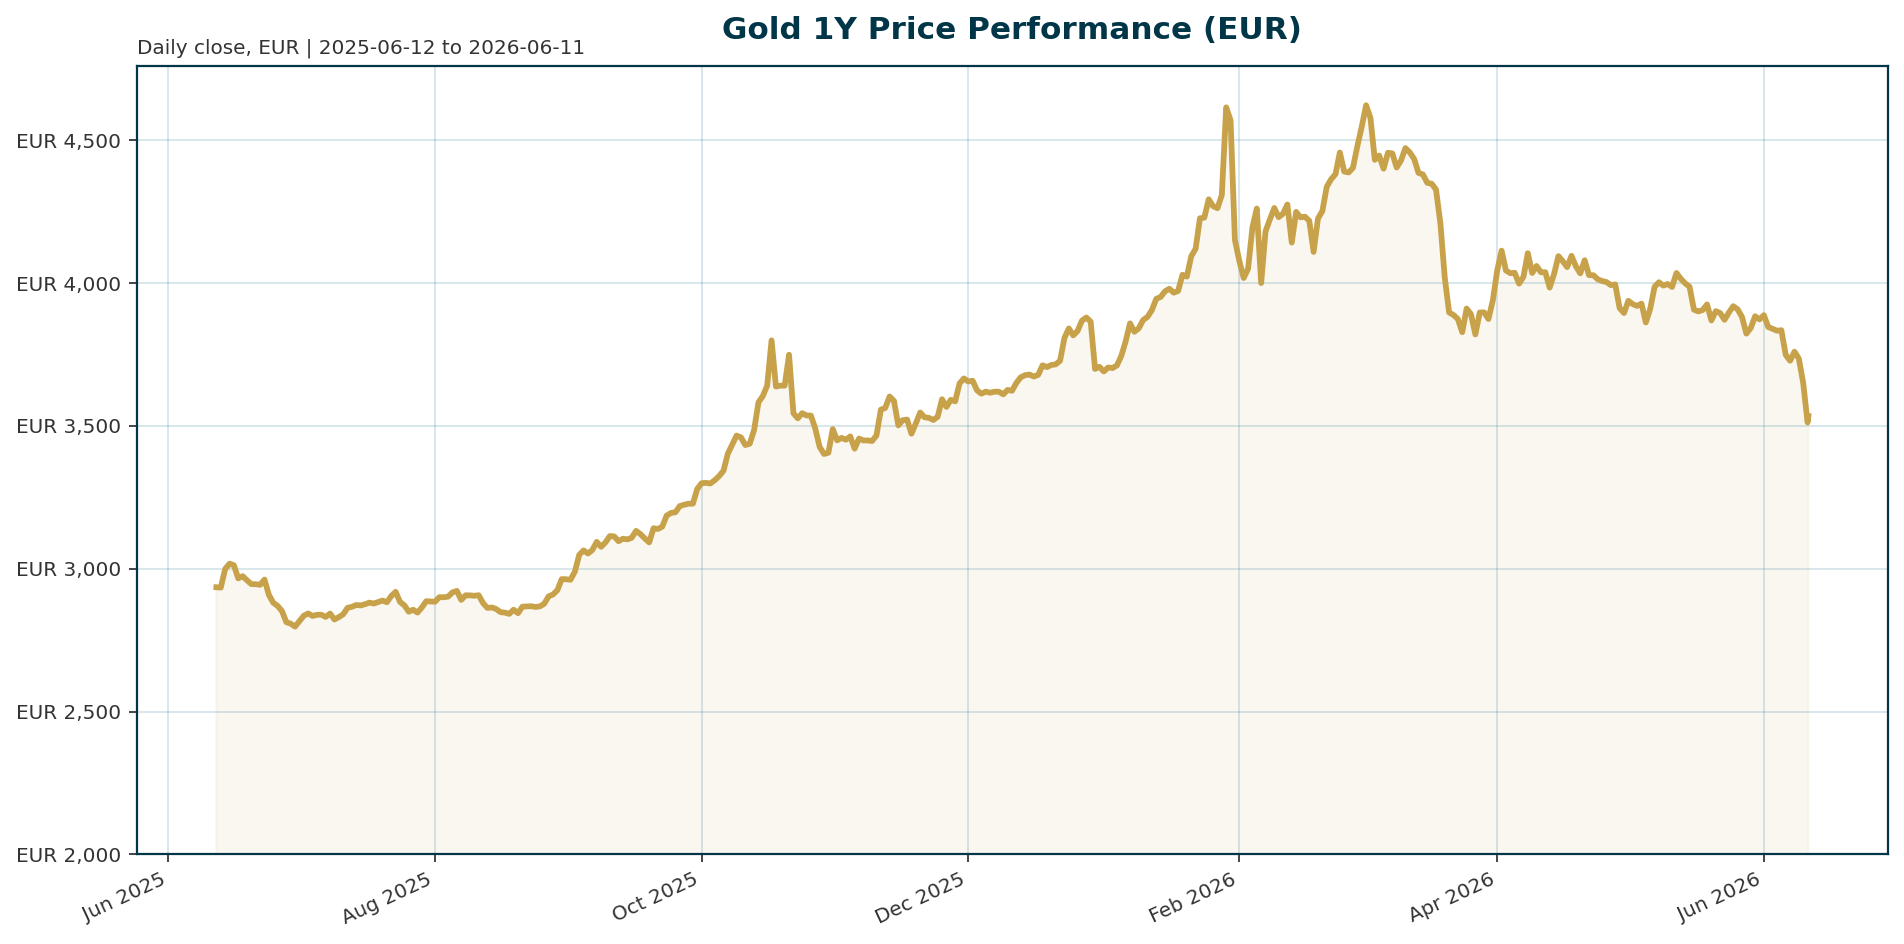
| Spot Price (EUR) | 3,536.62 | Trading below 200-day moving average |
| All-Time High (ATH) | 4,688.32 | Down -24.57% from Jan 2026 peak |
| 1-Year Change | +20.46% | Strong cumulative performance |
| 30-Day Change | -11.87% | Sharp correction phase |
| Bitcoin Dominance | 56.25% | Shift in digital asset allocation |
| Euro Area 10Y Yield | 3.10% | Supporting nominal yields |
| Central Bank Gold Share | 27% | Overtaking U.S. Treasuries (22%) [T7] |
Macro Backdrop
Risk sentiment is negative with equities under pressure, led by the Nasdaq Composite at -6.19% over five days. The rates backdrop is mixed, with the Euro Area AAA 10Y yield holding at 3.10% while the ECB prepares for its first rate hike since 2023. The FX backdrop is mixed, with EUR/USD weakening at 1.1555. Key observations include the Euro Stoxx 50 outperforming global peers and Eurozone inflation rising to 3.2% in May, which complicates the path for monetary policy [T6][T8].Investment Thesis
The core thesis centers on the structural shift from bond-centric monetary assets to hard money. As governments accumulate liabilities faster than economies can grow, policymakers face difficult choices between fiscal austerity, higher inflation, or debt monetization [T1]. This environment redefines gold not merely as an inflation hedge but as a store of value independent of the financial system. Central banks are actively voting with their reserves, with gold now representing 27% of global official assets, overtaking U.S. Treasuries at 22% [T7]. The “debasement trade” narrative suggests investors are shifting from fiat currencies into hard assets to protect purchasing power, creating a favorable long-term backdrop for gold [T3].Bullish Drivers
Central bank buying remains a structural pillar, with a net 244 tonnes purchased in Q1 2026, higher than quarterly averages [T3]. Turkey’s recent liquidation of $14 billion in U.S. Treasuries in favor of gold swaps highlights the functional hierarchy of reserves, where gold serves as core collateral during stress [T3]. If inflation pressures outpace the Federal Reserve’s response, real interest rates could turn negative, removing the opportunity cost headwind that has weighed on gold recently [T2]. Additionally, structural supply constraints and the ongoing debt cycle thesis provide a floor for prices [T1].Relative Positioning vs Bitcoin and Ethereum
Gold has recently exhibited high-beta characteristics, falling alongside risk assets during geopolitical spikes while rallying on peace deals [T7]. Currently, Bitcoin dominance stands at 56.25%, indicating a rotation into digital assets. However, the structural reserve diversification thesis favors gold as the ultimate hard money. If real yields compress or risk sentiment deteriorates further, gold could outperform the crypto sector as a “digital gold” alternative, whereas a strong equity rally might favor risk-on assets like Bitcoin.Scenario Framework
- Bullish Scenario: A durable peace agreement in the Middle East normalizes energy markets and reduces inflation expectations. This allows real yields to turn negative, removing the opportunity cost of holding gold. Central bank buying accelerates, and gold reclaims the 200-day moving average, targeting $4,600/oz [T5][T8].
- Bearish Scenario: Inflation remains sticky, prompting the Fed to maintain higher-for-longer rates. Real yields stay elevated, and the dollar strengthens. Gold breaks below the $4,000 support zone, trading as a risk asset rather than a safe haven [T5][T8].
- Stagflationary Trap: Energy prices stay high, maintaining elevated interest rates while capping real income growth. This creates a mixed-signal environment where gold’s traditional role as an inflation hedge competes with elevated real yield headwinds [T4].
Valuation Discussion
Gold is currently trading at a discount to its structural value proposition. The price has corrected -24.57% from its January 2026 ATH of 4,688.32 EUR, falling below the 200-day moving average [T5]. While elevated real yields and the inflation shock from Middle East tensions have pressured prices, the long-term valuation remains attractive relative to the debt cycle thesis. The current market price reflects a risk-off premium rather than a safe haven premium, presenting a potential entry point for long-term holders [T1][T3].Risks
The primary risk is a sustained rise in real yields due to sticky inflation or a hawkish policy response from the Federal Reserve. If the Fed shrinks its balance sheet meaningfully, it could force policymakers back toward easier monetary policy, which would benefit gold [T2]. Additionally, a geopolitical resolution that lowers energy prices could dampen the inflation premium supporting gold. Finally, a significant strengthening of the U.S. dollar could pressure the EUR-denominated price of gold [T6][T8].Appendix
Sources
- Debt cycle points to stronger case for gold price: Sprott – Mining.com [T1]
- Rising inflation may push real rates lower, setting the stage for gold’s next rally – WisdomTree’s Shah – KITCO [T2]
- Gold and silver will gain as rising debt and inflation reprice bonds and the broader market – Sprott’s Wong – KITCO [T3]
- Gold Price Momentum Amid Geopolitical Headwinds in 2026 – Discovery Alert [T4]
- $4,075/oz gold is now in play, and the price will need to challenge $4,600 before bullish momentum resumes – Saxo Bank’s Hansen – KITCO [T5]
- Gold gets no boost from geopolitical conflict, Russia makes outsized precious metals output claims for 2026 – Heraeus – KITCO [T6]
- Why gold is now more like a risk asset – Axios [T7]
- Gold breaks toward $4,000 as oil, yields weigh on metals – Kitco PM Report – KITCO [T8]
This report is AI-generated for informational purposes only and does not constitute investment advice. The views expressed herein are those of the model and do not reflect the opinions of Venice.ai or its developers.
Important Note / Wichtiger Hinweis:
EN: This report may have been generated using AI. It processes data from publicly available sources. The content is provided for informational purposes only.DE: Dieser Bericht kann mithilfe von KI erstellt worden sein. Dabei werden Daten aus öffentlich zugänglichen Quellen verarbeitet. Die Inhalte dienen ausschließlich Informationszwecken.
* DE: Die ergänzenden Inhalte können KI-generiert sein. EN: The additional content may be AI-generated.