
Listen to the summary
Key Data Snapshot
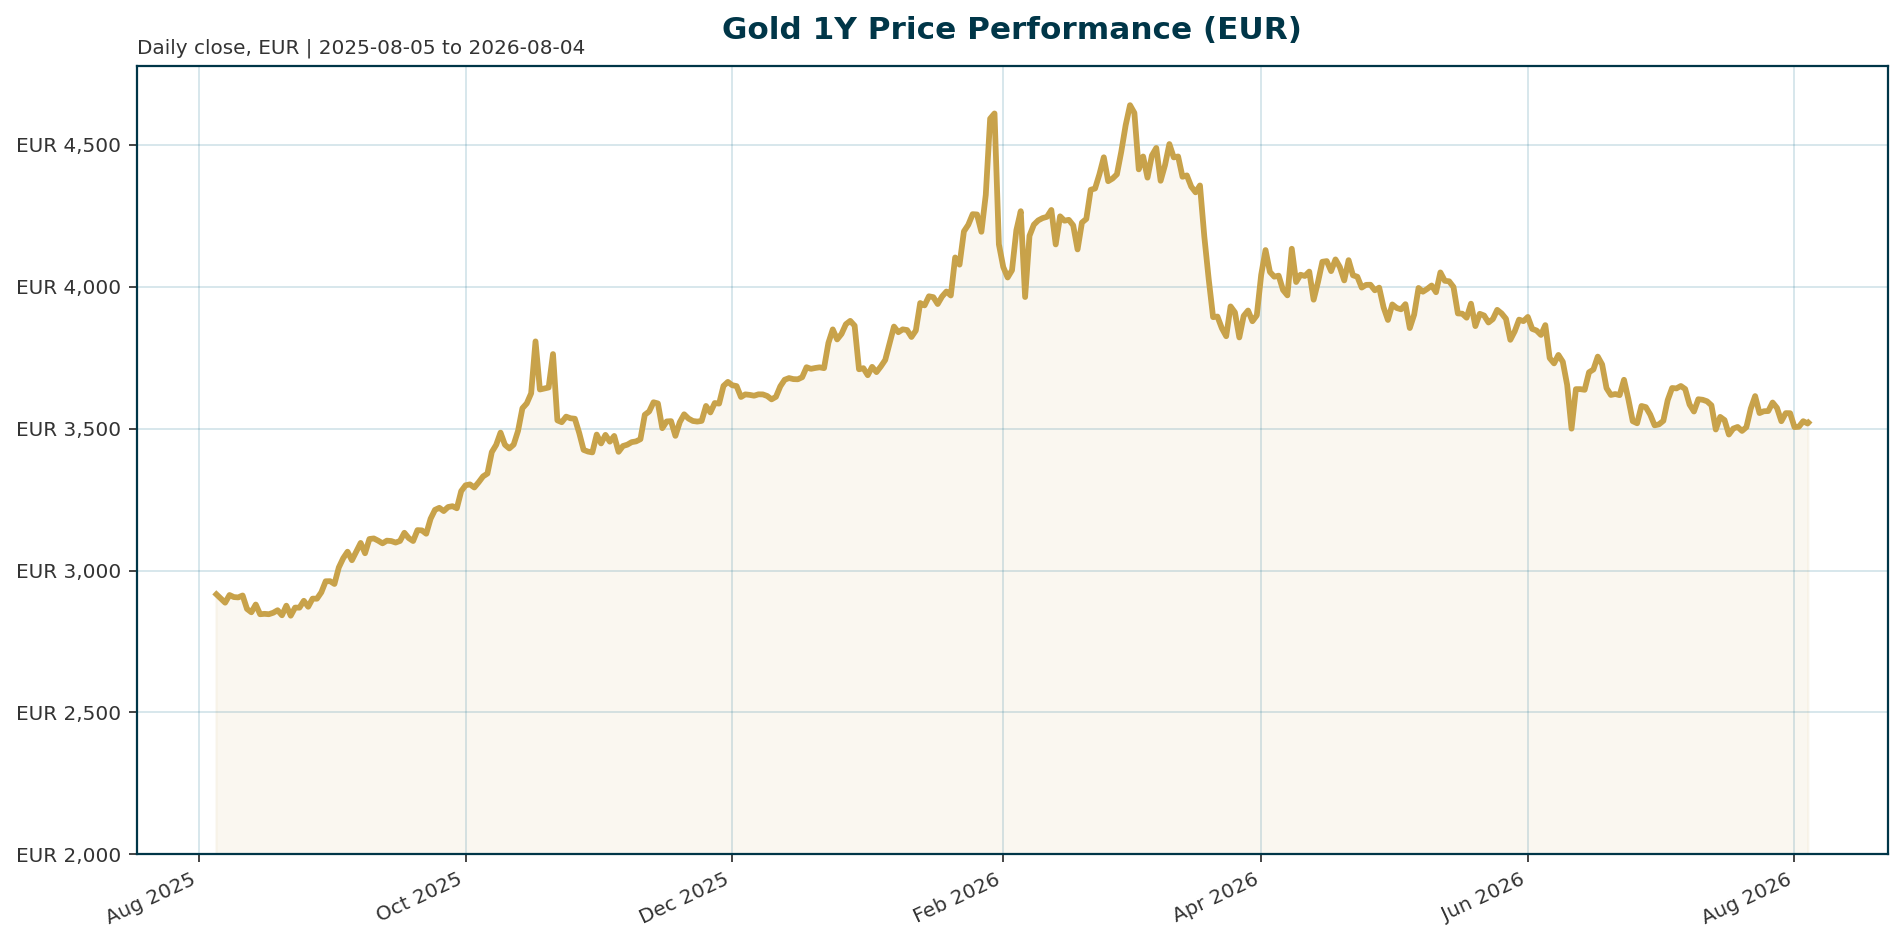
| Metric | Value | Context |
|---|---|---|
| XAU/EUR Price | 3,519.90 | Current market price in EUR |
| All-Time High (ATH) | 4,688.32 | Recorded Jan 28, 2026 [T5] |
| Drawdown from ATH | 24.9% | (4,688.32 – 3,519.90) / 4,688.32 |
| Year-to-Date Change | -7.76% | Worst quarter since Q2 2013 [T5] |
| Real Yields (Est.) | ~2.0% | High by recent standards but inside historical compounding band [T1] |
| Euro Area 10Y Yield | 3.23% | AAA sovereign yield benchmark [market_overview] |
| EUR/USD | 1.1520 | FX pair impacting EUR-denominated assets [market_overview] |
Macro Backdrop
Global risk sentiment is currently neutral to positive, with equity momentum mixed as the Nasdaq Composite leads with a strong 5-day move of 4.17%, while the Hang Seng lags at 0.17% [market_overview]. The Euro area shows broadly in-line performance with global indicators, though the Euro area AAA 10Y yield sits at 3.23% with a 5-day increase of 6.2 basis points, creating a mixed rates backdrop [market_overview]. FX markets are also mixed, with EUR/USD holding steady at 1.1520. Key observations highlight the divergence between regional performance, specifically the Hang Seng leading on a 1-month basis at 10.72% versus the DAX [market_overview]. In the specific gold context, the Federal Reserve has held rates at an upper bound of 3.75% for five months, while inflation remains elevated at a CPI of 332.4 (91st percentile), keeping real yields around 2% and posing a headwind to non-yielding gold [T1][T5].Investment Thesis
Gold is currently navigating a consolidation phase following its record high in January 2026. The primary thesis suggests that while short-term performance is constrained by elevated real yields and a less dovish Fed stance, structural demand is robust. Gold is increasingly behaving as a rate-sensitive asset, where the opportunity cost of holding non-yielding bullion is high. However, the fundamental narrative remains constructive over the medium term. The World Gold Council survey indicates that central banks have accelerated their accumulation to an average of 1,000t over the past four years, a significant increase from the 500t average of the preceding decade [T6]. This structural support, coupled with a record 43% of global monetary authorities planning reserve increases to hedge against geopolitical risk and dollar concentration, provides a floor for the market even as it corrects from elevated valuations [T7].Bullish Drivers
The primary bullish catalyst for gold remains the potential for real yields to decline. If the Federal Reserve adopts a “look through” approach to oil-driven inflation, resulting in a delayed or insufficient rate hike response, real yields could turn negative [T8]. This scenario would mirror the 1970s environment, where gold rallied across a multi-year timeframe due to policy paralysis and suppressed real yields [T8]. Additionally, persistent geopolitical instability in the Middle East continues to drive demand for gold as a crisis hedge, with nearly 90% of central bank respondents viewing gold as critical during crises [T6]. Finally, the “hot money” in ETFs is beginning to wake up as the macro backdrop stabilizes, suggesting potential inflows if the market breaks resistance levels [T1].Relative Positioning vs Bitcoin and Ethereum
Gold’s current positioning is increasingly correlated with real yields rather than traditional risk sentiment, which currently favors risk-on assets like the Nasdaq Composite [market_overview]. While Bitcoin and Ethereum remain highly sensitive to broader market liquidity and risk appetite, gold maintains its status as the primary safe haven during periods of stress. With BTC dominance at 56.4% and total crypto market cap at $1.97T, the crypto sector is a significant risk asset [market_data]. As long as the Fed maintains its hawkish stance and real yields remain elevated, gold may underperform crypto in the short term. However, should risk sentiment deteriorate or inflation spike, gold is likely to decouple and outperform, acting as a stabilizer in portfolios [T4].Scenario Framework
- Base Case: The Federal Reserve cuts rates by 25 basis points in September and December as inflation shows signs of moderating. Real yields fall from ~2% to 1.5%. Gold rallies to 3,800-4,000 EUR, reclaiming a significant portion of the recent drawdown.
- Bear Case: The Fed delays cuts into 2027, and real yields rise above 2.5% due to sticky inflation or stronger-than-expected economic data. Gold tests the 3,000 EUR support level, pressured by a stronger USD and profit-taking.
- Bull Case: A major oil supply shock triggers stagflation. The Fed is forced to look through inflation, keeping real yields negative. Gold surges to challenge the 5,000 EUR ATH, driven by both inflation hedging and reserve diversification demand.
Valuation Discussion
Current XAU/EUR levels offer a margin of safety relative to the January 2026 ATH of 4,688.32, representing a 24.9% discount [market_data]. While the year-to-date performance of -7.76% reflects the worst quarter in 13 years, valuation is not stretched relative to the current real yield environment of ~2% [T1][T5]. The asset is currently priced for a “status quo” macro environment. A re-rating to the highs would require a reversion in real yield expectations, not just a recovery in nominal prices. The “Golden Era” thesis is supported by the fact that current real yields, while high, are still within the historical band where gold has compounded effectively [T1].Risks
The primary risk to the thesis is a sustained hawkish pivot by the Federal Reserve. If real yields rise faster than anticipated, the opportunity cost of holding gold increases materially. Additionally, a stronger USD, currently trading at 1.1520, will continue to pressure XAU/EUR specifically [market_overview]. Profit-taking remains a risk, as gold is up roughly 6% year-to-date and vulnerable to bouts of selling after its worst quarter in 13 years [T3]. Finally, while geopolitical risks are elevated, they are currently insufficient to drive prices without a corresponding shift in monetary policy, as markets are focused on the path of inflation and real yields [T3].Appendix
Sources
- Central Banks Are Snapping Up Gold, ETF Investors Are Just Waking Up: The Best Gold ETFs to Own Before It Hits $5,000 – 24/7 Wall St. [T1]
- Gold: Between inflation fears and diversification of reserves – UBS [T2]
- Geopolitics alone isn’t enough to lift gold | ING THINK [T3]
- Both Gold and Silver Lose Key Support Levels! Has Last Year’s Get-Rich-Quick Myth Finally Ended? | Bitget News [T4]
- Gold suffers worst quarter in 13 years amid interest rate hike fears – CNBC [T5]
- Central Bank Gold Purchases Hit 1,000t Average: WGC Survey [T6]
- Is it a golden era for gold? | J.P. Morgan Private Bank U.S. [T7]
- Gold & Oil Embargo: Historic and Modern Impact on Gold Prices [T8]
This report is AI-generated by GLM 4.7 Flash for informational purposes only and does not constitute investment advice. Please consult a qualified financial advisor before making investment decisions.
Important Note / Wichtiger Hinweis:
EN: This report may have been generated using AI. It processes data from publicly available sources. The content is provided for informational purposes only.DE: Dieser Bericht kann mithilfe von KI erstellt worden sein. Dabei werden Daten aus öffentlich zugänglichen Quellen verarbeitet. Die Inhalte dienen ausschließlich Informationszwecken.
* DE: Die ergänzenden Inhalte können KI-generiert sein. EN: The additional content may be AI-generated.