
Key Data Snapshot
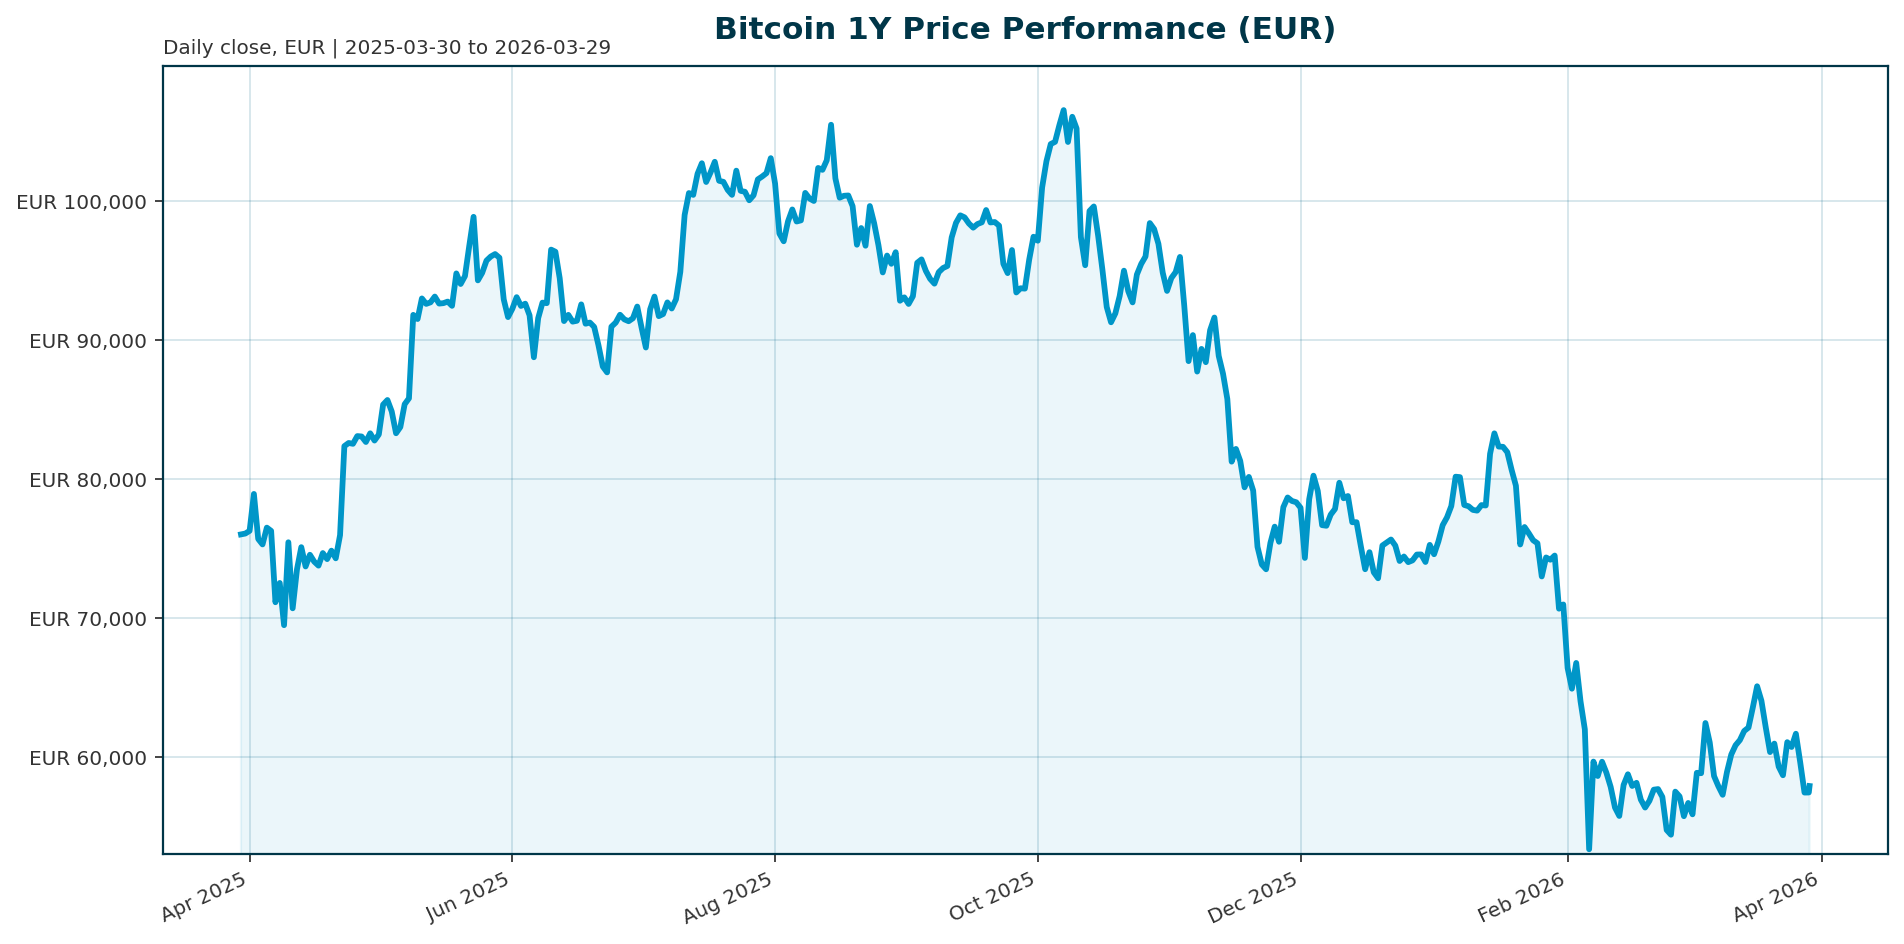
Bitcoin currently trades at 57,920 EUR, representing a 46.2% drawdown from the October 2025 all-time high of 107,662 EUR. The asset maintains market dominance of 56.09% within the broader crypto ecosystem.
| Metric | Value |
|---|---|
| Current Price (EUR) | 57,920.00 |
| Market Cap (EUR) | 1.16T |
| 24h Volume (EUR) | 19.74B |
| All-Time High (ATH) | 107,662.00 (Oct 2025) |
| ATH Drawdown | -46.20% |
| 200-Day Return | -39.13% |
| BTC Dominance | 56.09% |
Market Setup
The market is navigating a complex macro environment marked by geopolitical tension and energy volatility. Bitcoin has demonstrated relative resilience, declining only 0.2% over the past month compared to 4-5% drops in the S&P 500 and Nasdaq [T1]. However, the asset remains in a consolidation phase following previous deleveraging cycles [T1]. Macro headwinds, specifically a resurgence in oil prices above $100 per barrel and uncertainty surrounding the Ukraine conflict, are driving broader risk-off sentiment [T3].
Investment Thesis
The core investment thesis centers on Bitcoin’s transition from a speculative risk asset to a recognized institutional-grade store of value. Despite current macro headwinds, the narrative of institutionalization remains intact. Strategy is accelerating its crypto purchases, signaling confidence in the asset’s long-term value proposition [T4]. Furthermore, US Bitcoin ETFs have accumulated $56 billion in net inflows since their inception in 2024, providing a structural floor for liquidity [T4]. The asset’s decentralized nature, characterized by high daily liquidity of approximately $50 billion, insulates it from single-point failures [T4].
Bullish Drivers
Several factors suggest potential for a durable rally. First, there are early signs the crypto market has passed peak pessimism [T1]. Second, Bitcoin ETFs are currently on pace for their first month of net inflows since October, which could trigger a technical breakout [T4]. Third, Coinbase notes that Bitcoin has materially outperformed traditional assets on a risk-adjusted basis since the start of the Iran war, indicating that the deleveraging cycle may be nearing completion [T1]. Finally, the continued accumulation by public companies like Strategy, which holds approximately 65% of all public corporate Bitcoin, provides significant support for prices during retail deleveraging [T4].
Relative Positioning vs Gold and Ethereum
Bitcoin’s performance is currently juxtaposed against traditional safe havens and smart contract platforms. While Bitcoin shows resilience against equities [T1], traditional institutions are flocking to gold during periods of volatility. Lion Global Investors recently launched a physical gold ETF, reflecting a ‘bunker mentality’ among institutional investors seeking safety amidst the Iran war and oil shock [T6]. In contrast, Ethereum is sliding alongside software stocks, correlating with broader tech sector sentiment following leaks regarding new AI models [T2]. This suggests a bifurcation where Bitcoin is viewed as a distinct risk asset with institutional backing, while Ethereum remains tethered to the volatile software and AI markets.
Scenario Framework
- Base Case: Geopolitical risks stabilize, and oil prices remain range-bound. Bitcoin consolidates between 55,000 and 60,000 EUR, supported by sustained ETF inflows and corporate accumulation.
- Bull Case: Macro easing occurs, and retail deleveraging concludes. If ETF inflows turn positive for consecutive months, Bitcoin could reclaim the 65,000 EUR level and challenge the 70,000 EUR psychological barrier.
- Bear Case: Escalation of the oil shock or a significant AI sector downturn triggers a broader market crash. Retail investors drive widespread selling, and ETF outflows accelerate, potentially pushing Bitcoin below 50,000 EUR.
Valuation Discussion
Bitcoin is currently trading at a significant discount to its October 2025 ATH, offering a compelling risk-reward profile for accumulation. The market capitalization of 1.16T EUR represents roughly 56% of the total crypto market cap of 2.07T EUR [Data]. While the 200-day return remains negative at -39.13%, the asset’s dominance and institutional backing suggest it is leading the broader market recovery. The valuation is supported by the $56 billion in cumulative ETF inflows, which provide a steady demand sink that was absent in previous cycles [T4].
Risks
The primary risks to the current thesis are macroeconomic and sector-specific. A resurgence in oil prices as an “active transmission channel for global inflation” could force central banks to maintain tight monetary policy, pressuring all risk assets [T1]. Additionally, the “AI bust” narrative poses a systemic risk; while not as catastrophic as the dot-com crash, an AI downturn could cause “almost no place to hide” due to the widespread impact of index funds [T7]. Retail investors are currently driving widespread selling pressure, evidenced by a single-day outflow of $171 million from Bitcoin ETFs [T2].
Appendix
Sources
- Bitcoin Price Slides but Holds Up Better Than Stocks as Oil Shock Continues – Decrypt [T1]
- Bitcoin price (BTC) slides alongside software stocks following leak of new Anthropic model – CoinDesk [T2]
- Bitcoin (BTC) news: Macro risks mount as Ukraine adds to oil market uncertainty – CoinDesk [T3]
- Strategy is accelerating its crypto purchases as rivals sit on the sidelines – CNBC [T4]
- Why one hedge fund veteran is urging investors to ‘prepare for the worst’ – CNBC [T5]
- Lion Global Investors launches a physical gold ETF amid price volatility due to the Iran war – CNBC [T6]
- Tech guru Igor Pejic says an AI bust wouldn’t rival the dot-com crash — but there’d be almost ‘no place to hide’ – Business Insider [T7]
This report is AI-generated, for informational purposes only, and not investment advice. The data presented is based on market information available up to 2026-03-29 and may not reflect real-time market conditions.
Important Note / Wichtiger Hinweis:
EN: This report may contain AI-assisted analysis or be generated entirely by AI, which processes market data from publicly available sources for which altii accepts no responsibility for its accuracy. We strongly advise against using this report as a basis for investment decisions.
DE: Dieser Bericht kann KI-gestützte Analysen enthalten oder vollständig von KI erstellt worden sein, die Marktdaten aus öffentlich zugänglichen Quellen verarbeitet, für deren Richtigkeit altii keine Verantwortung übernimmt. Wir raten dringend davon ab, diesen Bericht als Grundlage für Anlageentscheidungen zu verwenden.