
Key Data Snapshot
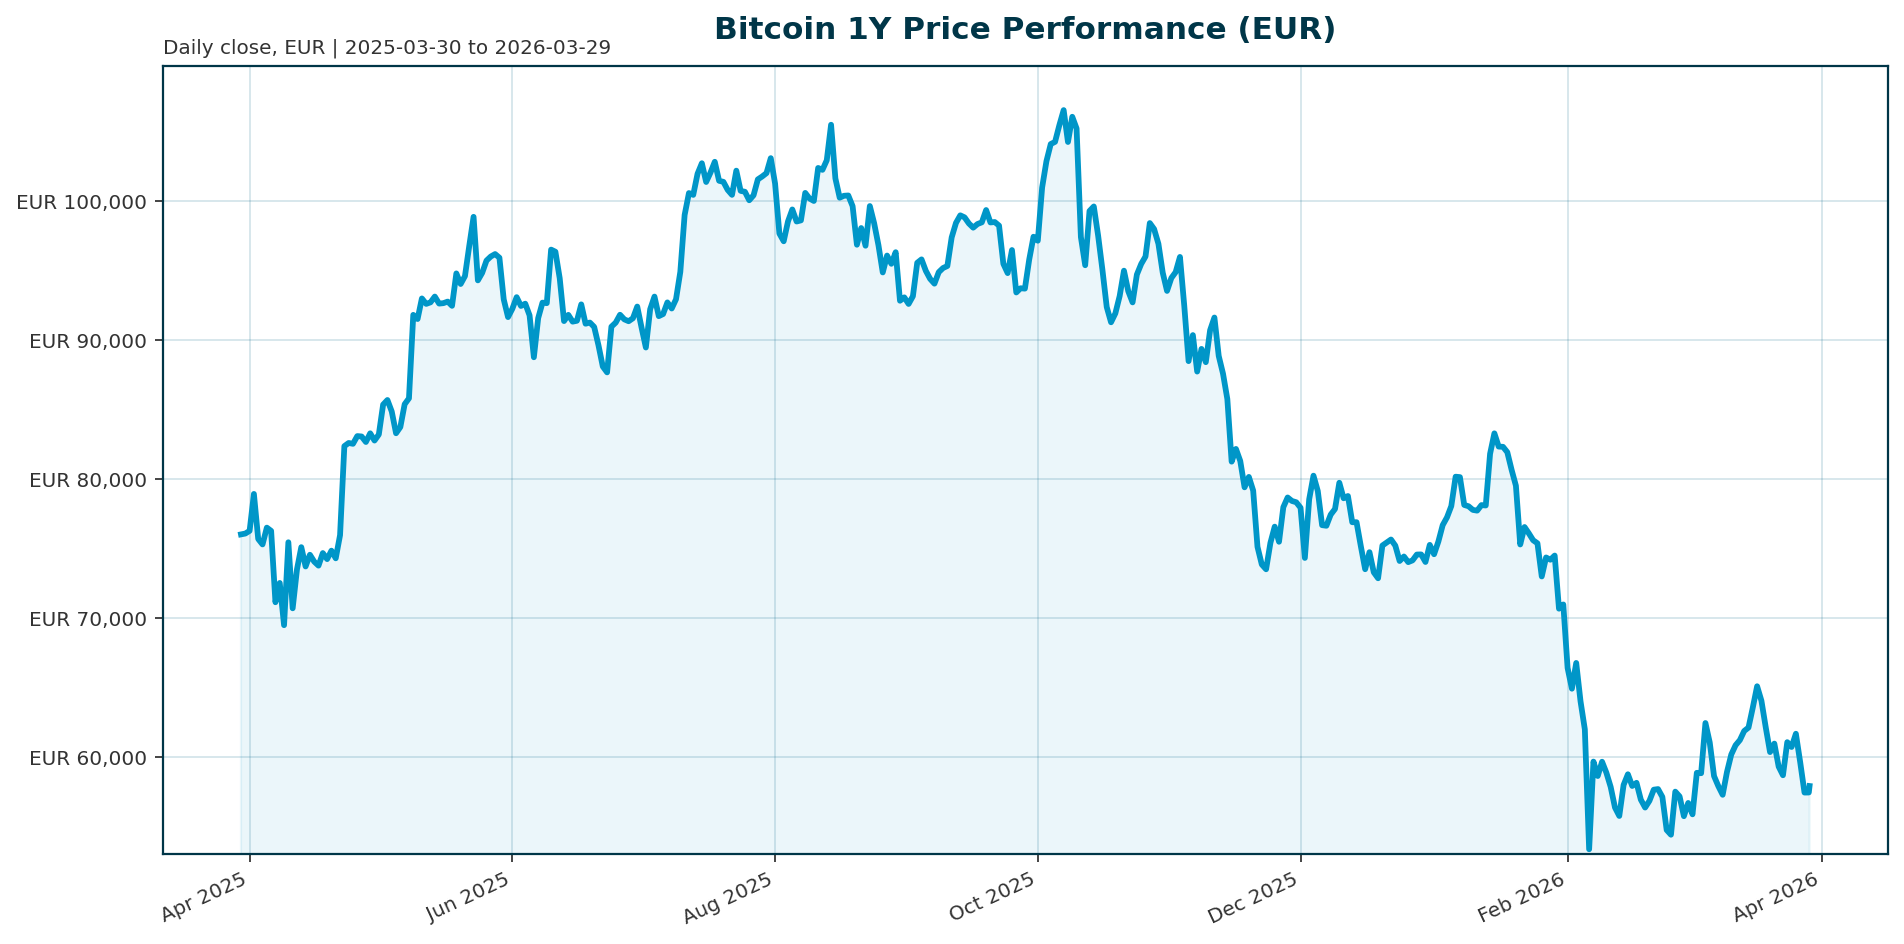
Bitcoin currently trades at 57,920 EUR, representing a 46.2% drawdown from the October 2025 all-time high of 107,662 EUR. The asset maintains market dominance of 56.09% within the broader crypto ecosystem.
| Metric | Value |
|---|---|
| Current Price (EUR) | 57,920.00 |
| Market Cap (EUR) | 1.16T |
| 24h Volume (EUR) | 19.74B |
| All-Time High (ATH) | 107,662.00 (Oct 2025) |
| ATH Drawdown | -46.20% |
| 200-Day Return | -39.13% |
| BTC Dominance | 56.09% |
Market Setup
The market is navigating a complex macro environment marked by geopolitical tension and energy volatility. Bitcoin has demonstrated relative resilience, declining only 0.2% over the past month compared to 4-5% drops in the S&P 500 and Nasdaq [T1]. However, the asset remains in a consolidation phase following previous deleveraging cycles [T1]. Macro headwinds, specifically a resurgence in oil prices above $100 per barrel and uncertainty surrounding the Ukraine conflict, are driving broader risk-off sentiment [T3].
Investment Thesis
The core investment thesis centers on Bitcoin’s transition from a speculative risk asset to a recognized institutional-grade store of value. Despite current macro headwinds, the narrative of institutionalization remains intact. Strategy is accelerating its crypto purchases, signaling confidence in the asset’s long-term value proposition [T4]. Furthermore, US Bitcoin ETFs have accumulated $56 billion in net inflows since their inception in 2024, providing a structural floor for liquidity [T4]. The asset’s decentralized nature, characterized by high daily liquidity of approximately $50 billion, insulates it from single-point failures [T4].
Bullish Drivers
Several factors suggest potential for a durable rally. First, there are early signs the crypto market has passed peak pessimism [T1]. Second, Bitcoin ETFs are currently on pace for their first month of net inflows since October, which could trigger a technical breakout [T4]. Third, Coinbase notes that Bitcoin has materially outperformed traditional assets on a risk-adjusted basis since the start of the Iran war, indicating that the deleveraging cycle may be nearing completion [T1]. Finally, the continued accumulation by public companies like Strategy, which holds approximately 65% of all public corporate Bitcoin, provides significant support for prices during retail deleveraging [T4].
Relative Positioning vs Gold and Ethereum
Bitcoin’s performance is currently juxtaposed against traditional safe havens and smart contract platforms. While Bitcoin shows resilience against equities [T1], traditional institutions are flocking to gold during periods of volatility. Lion Global Investors recently launched a physical gold ETF, reflecting a ‘bunker mentality’ among institutional investors seeking safety amidst the Iran war and oil shock [T6]. In contrast, Ethereum is sliding alongside software stocks, correlating with broader tech sector sentiment following leaks regarding new AI models [T2]. This suggests a bifurcation where Bitcoin is viewed as a distinct risk asset with institutional backing, while Ethereum remains tethered to the volatile software and AI markets.
Scenario Framework
- Base Case: Geopolitical risks stabilize, and oil prices remain range-bound. Bitcoin consolidates between 55,000 and 60,000 EUR, supported by sustained ETF inflows and corporate accumulation.
- Bull Case: Macro easing occurs, and retail deleveraging concludes. If ETF inflows turn positive for consecutive months, Bitcoin could reclaim the 65,000 EUR level and challenge the 70,000 EUR psychological barrier.
- Bear Case: Escalation of the oil shock or a significant AI sector downturn triggers a broader market crash. Retail investors drive widespread selling, and ETF outflows accelerate, potentially pushing Bitcoin below 50,000 EUR.
Valuation Discussion
Bitcoin is currently trading at a significant discount to its October 2025 ATH, offering a compelling risk-reward profile for accumulation. The market capitalization of 1.16T EUR represents roughly 56% of the total crypto market cap of 2.07T EUR [Data]. While the 200-day return remains negative at -39.13%, the asset’s dominance and institutional backing suggest it is leading the broader market recovery. The valuation is supported by the $56 billion in cumulative ETF inflows, which provide a steady demand sink that was absent in previous cycles [T4].
Risks
The primary risks to the current thesis are macroeconomic and sector-specific. A resurgence in oil prices as an “active transmission channel for global inflation” could force central banks to maintain tight monetary policy, pressuring all risk assets [T1]. Additionally, the “AI bust” narrative poses a systemic risk; while not as catastrophic as the dot-com crash, an AI downturn could cause “almost no place to hide” due to the widespread impact of index funds [T7]. Retail investors are currently driving widespread selling pressure, evidenced by a single-day outflow of $171 million from Bitcoin ETFs [T2].
Appendix
Sources
- Bitcoin Price Slides but Holds Up Better Than Stocks as Oil Shock Continues – Decrypt [T1]
- Bitcoin price (BTC) slides alongside software stocks following leak of new Anthropic model – CoinDesk [T2]
- Bitcoin (BTC) news: Macro risks mount as Ukraine adds to oil market uncertainty – CoinDesk [T3]
- Strategy is accelerating its crypto purchases as rivals sit on the sidelines – CNBC [T4]
- Why one hedge fund veteran is urging investors to ‘prepare for the worst’ – CNBC [T5]
- Lion Global Investors launches a physical gold ETF amid price volatility due to the Iran war – CNBC [T6]
- Tech guru Igor Pejic says an AI bust wouldn’t rival the dot-com crash — but there’d be almost ‘no place to hide’ – Business Insider [T7]
This report is AI-generated, for informational purposes only, and not investment advice. The data presented is based on market information available up to 2026-03-29 and may not reflect real-time market conditions.
Important Note / Wichtiger Hinweis:
EN: This report may have been generated using AI. It processes data from publicly available sources. The content is provided for informational purposes only.DE: Dieser Bericht kann mithilfe von KI erstellt worden sein. Dabei werden Daten aus öffentlich zugänglichen Quellen verarbeitet. Die Inhalte dienen ausschließlich Informationszwecken.
* DE: Die ergänzenden Inhalte können KI-generiert sein. EN: The additional content may be AI-generated.