
Key Data Snapshot
| Metric | Value |
|---|---|
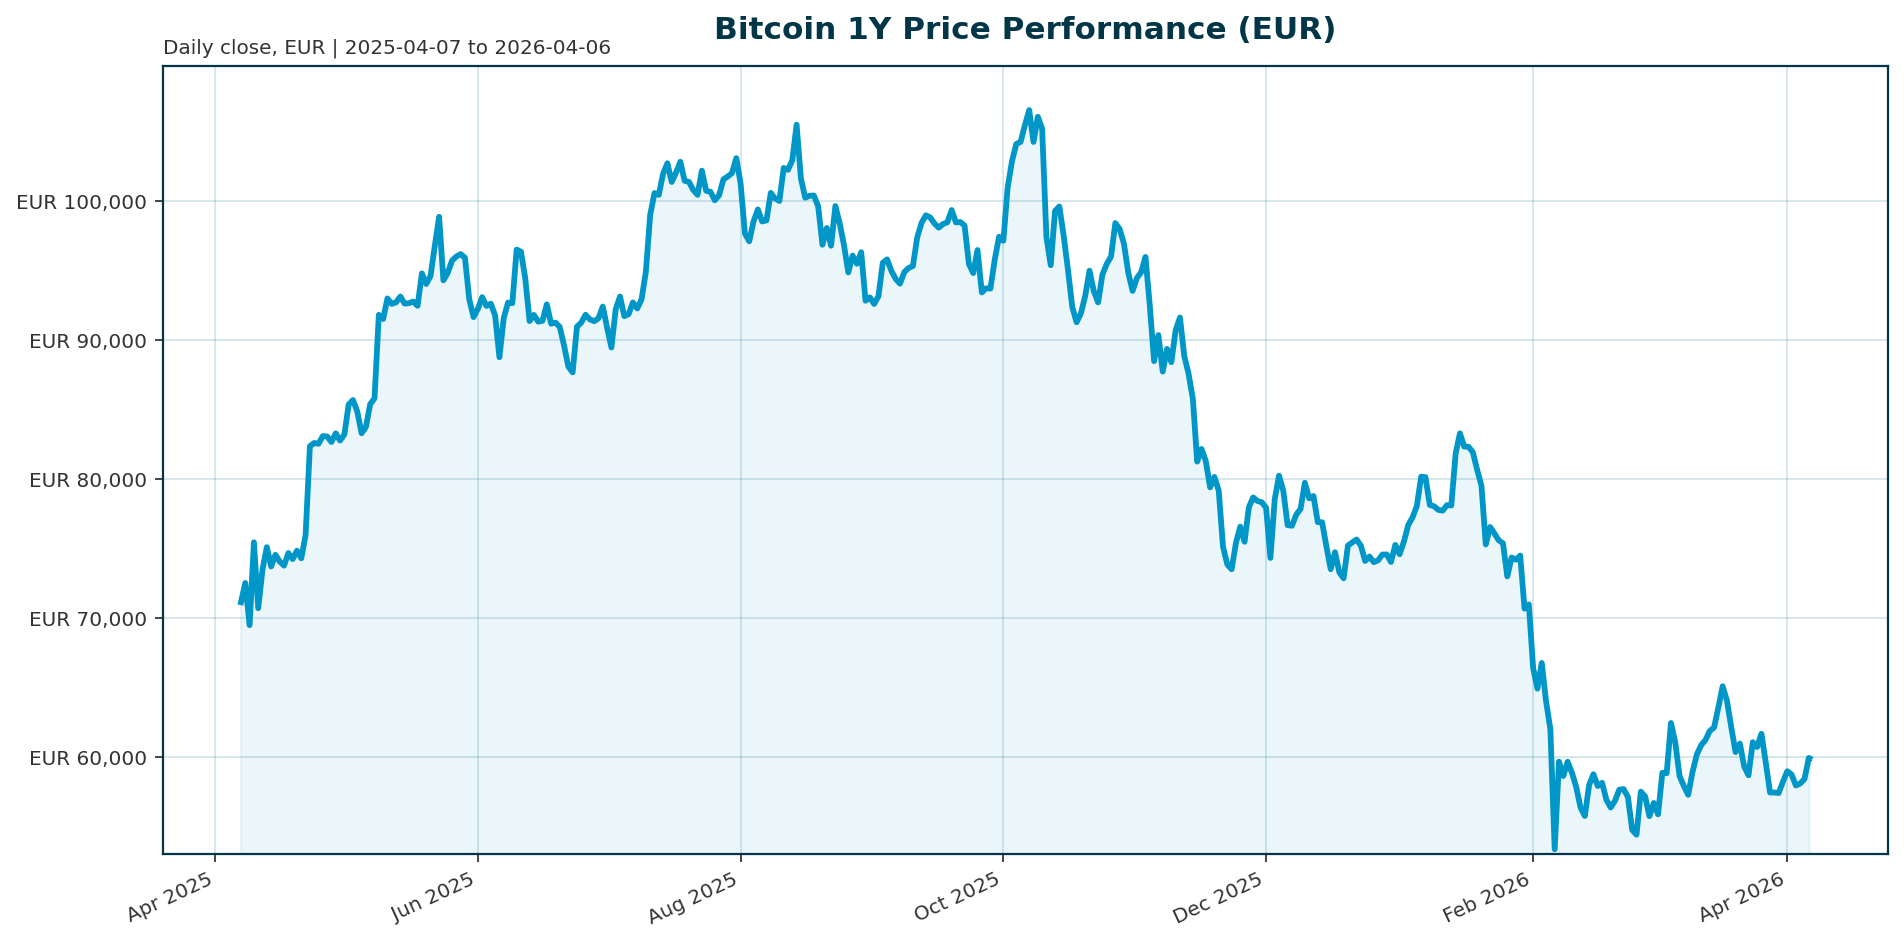
| Current Price (EUR) | 59,904.00 |
| Market Capitalization (EUR) | 1.198T |
| All-Time High (ATH) | 107,662.00 (Oct 2025) |
| ATH Drawdown | 44.36% |
| Market Cap Dominance | 56.51% |
| 24h Volume (EUR) | 23.88B |
| 200-Week Moving Average | 59,268.00 |
| Realized Price | 54,177.00 |
| Whale Sell-Off (365d) | 188,000 BTC |
Key Calculation: The current drawdown from the October 2025 ATH represents a 44.36% decline. This contrasts with historical drawdowns of 80% to 90%, signaling a compression in volatility and a maturing market structure [T1][T4][T6].
Market Setup
Bitcoin is currently navigating a consolidation phase following a significant drawdown from its highs. The asset is trading above critical long-term support levels, specifically the 200-week moving average at 59,268 EUR and the realized price at 54,177 EUR [T6]. These technical levels have historically acted as floors in previous bear markets, and their current support suggests the downside risk is contained.
However, the market setup is characterized by a bifurcation of flows. On one hand, institutional liquidity is deepening, evidenced by the integration of ETFs and the maturation of market structure. On the other, significant selling pressure persists from large holders and corporate treasuries. Whales have shed 188,000 BTC since mid-2025, and U.S. listed companies including Riot Platforms and Nakamoto are offloading holdings, creating a supply headwind that tests the realized price support [T3][T4][T8].
Investment Thesis
The core investment thesis for Bitcoin has shifted from speculative venture capital to portfolio efficiency. As institutional participation grows, Bitcoin is evolving from an asset with extreme boom-and-bust cycles into a macro allocation tool with compressed volatility [T1].
Analysts argue that the tradeoff for this maturation is the normalization of returns. The asymmetric upside of early cycles came with extreme drawdowns, but as those drawdowns shrink to approximately 50%, Bitcoin increasingly behaves like a traditional financial asset rather than a high-risk venture [T1]. This transition allows for smaller allocations without materially increasing portfolio risk, positioning Bitcoin as a viable store of value and a hedge against traditional monetary debasement [T7].
Bullish Drivers
Institutional adoption is accelerating, providing a structural floor for the market. Legacy finance giants are deepening their crypto exposure through active management strategies rather than just passive ETFs. Franklin Templeton’s acquisition of 250 Digital and the planned launch of a spot ETF by Morgan Stanley signal a broader integration of digital assets into traditional portfolios [T2].
Furthermore, the ETF market is maturing. BlackRock’s iShares Bitcoin Trust (IBIT) saw inflows jump back up in March, snapping a four-month streak of negligible outflows, indicating renewed institutional appetite [T2]. The listing of CoinShares on the Nasdaq also highlights the growing legitimacy and tradability of crypto assets [T2]. VanEck’s Matthew Sigel has reinforced this thesis, stating that Bitcoin is a 100% viable asset depending on the timeframe, emphasizing its role in a diversified portfolio [T7].
Relative Positioning vs Gold and Ethereum
Current spot prices for Gold and Ethereum are unavailable in the provided dataset, preventing a direct comparative valuation analysis at this time. However, Bitcoin maintains a dominant position within the cryptocurrency ecosystem, holding a market cap dominance of 56.51% [T1].
Despite the unavailability of comparative price data, the narrative positioning suggests Bitcoin is increasingly competing with Gold as a digital store of value. The shift from speculative trading to institutional allocation aligns it more closely with the risk profile and utility of Gold, while the broader crypto market maturation supports Ethereum’s role as a complementary layer 1 asset. The correlation between Bitcoin and traditional risk assets remains a key factor to monitor, though the current drawdown suggests a decoupling from broader equity volatility [T6].
Scenario Framework
- Base Case: Bitcoin consolidates around the 60,000 EUR mark. Institutional inflows gradually absorb the selling pressure from whale wallets and corporate treasuries. The market stabilizes above the 200-week moving average, with volatility continuing to compress as the asset matures.
- Bull Case: A breakout above the October 2025 ATH of 107,662 EUR is triggered by a surge in institutional demand that outstrips corporate selling. This breakout would confirm the end of the bear market and initiate a “tradfi-like” uptrend characterized by measured, steady growth rather than parabolic spikes [T5].
- Bear Case: Continued selling from Digital Asset Treasuries (DATs) and miners triggers a contagion effect. If Bitcoin fails to hold the realized price support of 54,177 EUR, a deeper correction toward the 55,700 EUR to 58,200 EUR range could occur, driven by forced liquidations and a negative Coinbase premium [T4][T8].
Valuation Discussion
The “parabolic” era of Bitcoin appears to be over. Historical growth rates have slowed significantly, with the 2025 peak being less than twice the 2021 peak, compared to multipliers of 16x and 38x in previous cycles [T5]. This suggests that Bitcoin is transitioning into a slower, more sustainable growth phase.
Valuation is now more closely tied to institutional adoption metrics and macro liquidity conditions rather than speculative retail momentum. The current market cap of 1.198T EUR reflects the deep liquidity provided by ETFs and institutional treasuries, but is currently being pressured by the realization of losses by corporate holders. As the market absorbs these supply shocks, valuation multiples may normalize toward levels consistent with a mature asset class.
Risks
- Whale and Corporate Selling Pressure: The 188,000 BTC sell-off by major holders since mid-2025 represents a fundamental shift in supply dynamics. Continued selling from Digital Asset Treasuries, such as Nakamoto and Riot Platforms, poses a significant risk to price stability [T3][T4][T8].
- Macro Headwinds: The ongoing conflict in the Middle East has kept oil prices above $100 per barrel, complicating central bank policy decisions. This uncertainty could lead to tighter monetary conditions or delayed rate cuts, which are negative for risk assets [T6].
- Technological Risks: Renewed concerns regarding quantum computing risks have added another layer of uncertainty to the long-term outlook, potentially impacting investor sentiment and institutional confidence [T6].
- Market Structure Risks: A negative Coinbase premium and weakening demand from U.S. investors indicate that the current bullish narrative may not yet be broad-based enough to sustain a sustained rally [T4].
Appendix
Sources
- Bitcoin’s crashes are shrinking, and Wall Street is starting to notice – CoinDesk [T1]
- Franklin Templeton acquires digital assets investment firm in active crypto management push – CNBC [T2]
- From miners to Digital Asset Treasury (DAT) firms… Bitcoin selling pressure intensifies among U.S.-listed companies – Bloomingbit [T3]
- Bitcoin’s Structural Downturn Deepens with Whale Wallets Shedding 188,000 BTC – Bitget [T4]
- Bitcoin’s (BTC) parabolic era may be over as old peaks are tested – CoinDesk [T5]
- Bitcoin price analysis: BTC has never had a seven-month losing steak, but that could change – CoinDesk [T6]
- Bitcoin is a ‘100% viable asset,’ depending on when you start the clock, says VanEck’s Matthew Sigel – CNBC [T7]
- Nakamoto Bitcoin sale could signal industry-wide DAT contagion: Analyst – TradingView [T8]
This report is AI-generated for informational purposes only and does not constitute investment advice. The analysis provided is based on data available up to April 6, 2026, and should not be considered as a recommendation to buy or sell any financial instruments.
Important Note / Wichtiger Hinweis:
EN: This report may contain AI-assisted analysis or be generated entirely by AI, which processes market data from publicly available sources for which altii accepts no responsibility for its accuracy. We strongly advise against using this report as a basis for investment decisions.
DE: Dieser Bericht kann KI-gestützte Analysen enthalten oder vollständig von KI erstellt worden sein, die Marktdaten aus öffentlich zugänglichen Quellen verarbeitet, für deren Richtigkeit altii keine Verantwortung übernimmt. Wir raten dringend davon ab, diesen Bericht als Grundlage für Anlageentscheidungen zu verwenden.