
Listen to the summary
Key Data Snapshot
| Metric | Value |
|---|---|
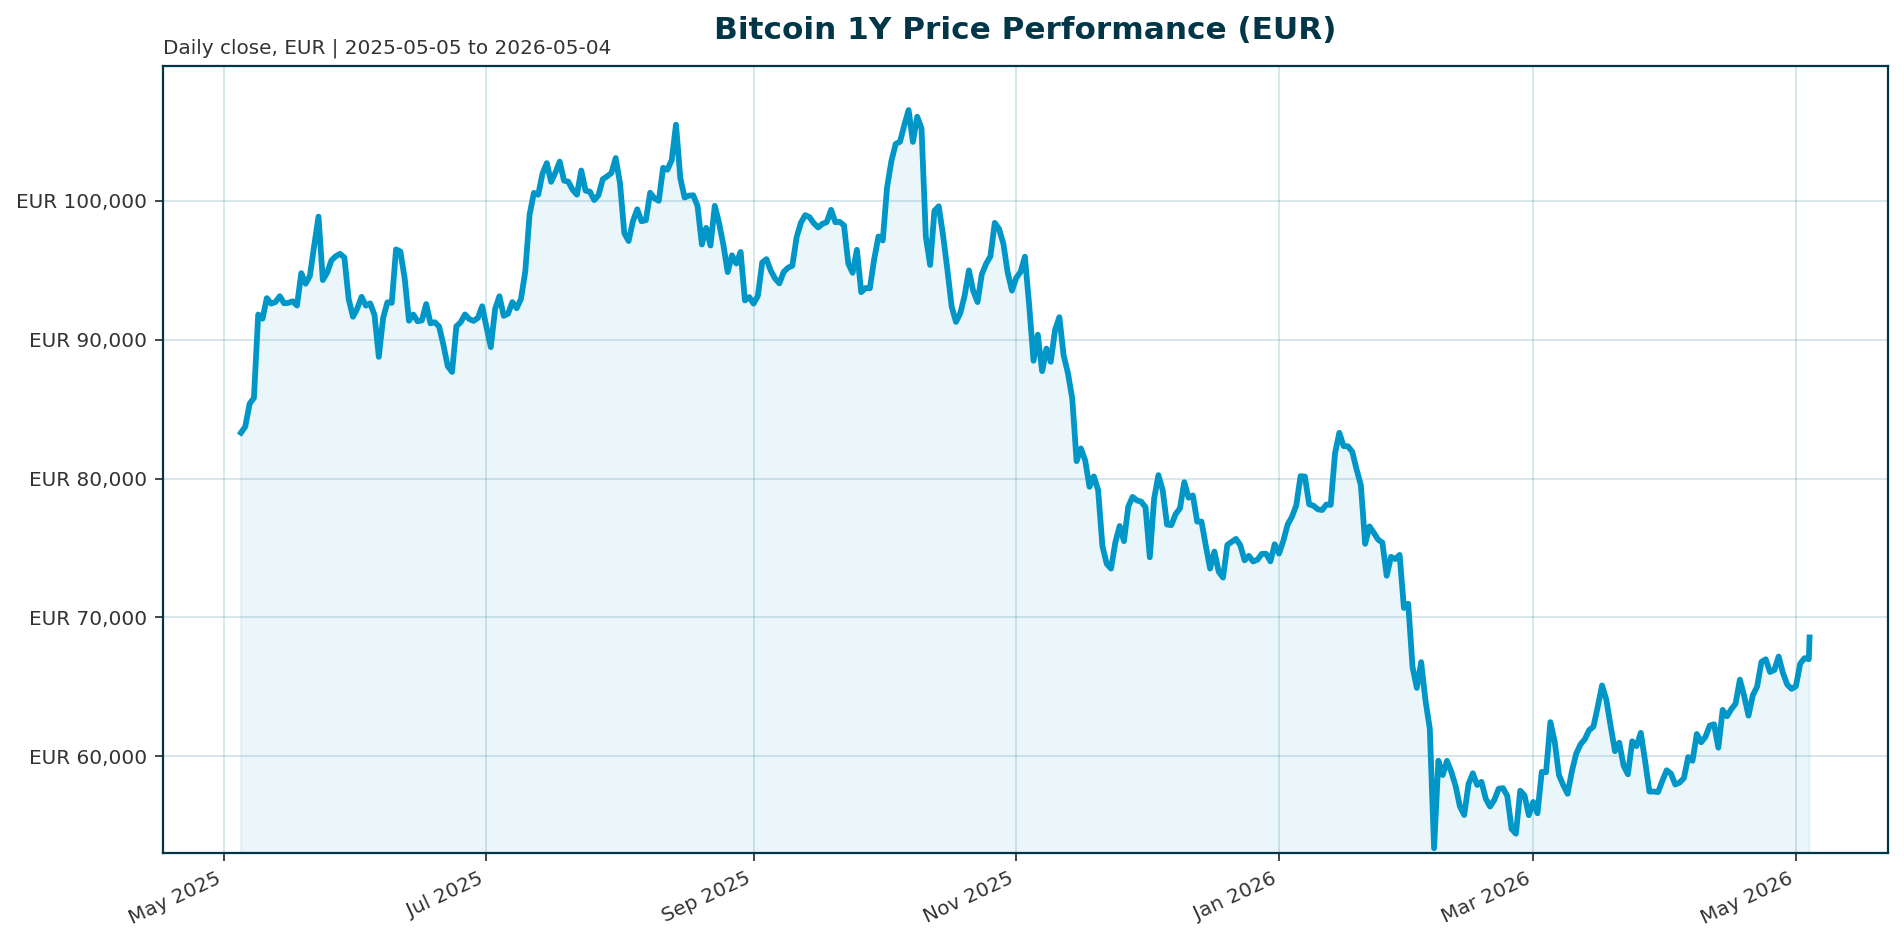
| Price (EUR) | 68,537.00 |
| Market Cap (EUR) | 1.37T |
| 24h Volume (EUR) | 26.47B |
| 24h Change | +2.86% |
| 30d Change | +8.20% |
| YTD Change | -19.24% |
| All-Time High (ATH) | 107,662.00 (Oct 2025) |
| ATH Change | -36.34% |
| BTC Dominance | 58.63% |
| Key Support | 73,308.00 |
| Key Resistance | 80,529.00 |
Market Setup
Risk sentiment is positive with broadly positive equity momentum. The Euro area yields a mixed curve with flattening pressure. The Euro is broadly weaker against the USD. Key observations include the Nasdaq Composite leading on a 1-month basis at 14.99% and the Hang Seng showing the strongest 5-day move at 1.05%. The Euro area AAA 10Y yield sits at 3.14% while the 2Y yield is 2.67%, tightening the spread to 47.8 basis points.Investment Thesis
Bitcoin is transitioning from a speculative risk asset to a regulated institutional store of value. Institutional demand remains resilient despite price dips, evidenced by $2.43B in April ETF inflows [T1]. However, the “digital gold” thesis faces pressure as physical gold has rallied 39.5% year-to-date, outperforming Bitcoin which is down 19.2% YTD [T6]. The market is currently navigating a bifurcation where miners are pivoting to AI/HPC infrastructure to diversify revenue [T3], while traditional finance seeks regulatory clarity through frameworks like the US Clarity Act.Bullish Drivers
The primary catalyst for Bitcoin is the US Clarity Act, with a 70% probability of passage this year. JPMorgan analysts predict this legislation could trigger a broader crypto market rebound through 2026 [T2]. Additionally, the migration of crypto infrastructure into regulated frameworks is accelerating, with the US poised to bring perpetual futures onshore and European banks like Societe Generale expanding services under MiCA [T8]. On the technical side, miners are increasingly insulated from pure price cycles by diversifying into AI-ready data centers [T5].Relative Positioning vs Gold and Ethereum
Bitcoin currently trades at a discount to its 2025 ATH of 107,662 EUR, down 36.34% from the peak. In contrast, Gold has surged 39.5% YOY, attracting $191B in ETF inflows in January 2026, the strongest month on record [T6]. This outperformance challenges Bitcoin’s store-of-value narrative. Conversely, Ethereum is experiencing a supply shock via BlackRock’s Staked ETH ETF (ETHB), which has locked 261,337 ETH into validators, creating a concentrated demand scenario that contrasts with Bitcoin’s current liquidity dynamics [T4].Scenario Framework
- Bullish Case (70%): The US Clarity Act passes mid-year. Regulatory clarity unlocks institutional capital, allowing Bitcoin to break the 80,529 EUR resistance level and target the 100,000 EUR ATH.
- Base Case (20%): Regulatory clarity is achieved but delayed. Bitcoin consolidates between 65,000 EUR and 75,000 EUR as the market absorbs the Clarity Act’s implications.
- Bearish Case (10%): The Clarity Act fails or faces significant pushback. Bitcoin tests the 73,308 EUR support level, risking a cascade of long liquidations totaling 1.764 billion USD.
Valuation Discussion
Bitcoin is currently trading at a discount to its historical high, offering a lower entry point for long-term holders. The market cap of 1.37T EUR represents a 58.63% dominance over the total crypto market cap. Valuation models should incorporate the growing revenue streams from miners pivoting to AI infrastructure, which could provide a floor for miner valuations independent of Bitcoin price cycles [T3].Risks
A significant regulatory headwind exists if traditional banks increase their opposition efforts to the Clarity Act [T2]. Geopolitical instability, such as stalled US-Iran peace talks and the closure of the Strait of Hormuz, could trigger a flight to safety, benefiting Gold over Bitcoin [T6]. Furthermore, miners remain heavily reliant on Bitcoin prices for cash flow, and a sustained decline below support levels could pressure their balance sheets.Appendix
Sources
- Cryptocurrency mining company Riot Platforms sells another 500 bitcoins – WEEX [T1]
- ‘Go Time’—White House Quietly Confirms ‘Imminent’ May Bitcoin Price Game-Changer – Forbes [T2]
- AI Pivot Sparks Mining Stocks Rally Relative to Bitcoin in 2026 – MEXC [T3]
- ‘Removes Supply’—Ethereum Suddenly Faces BlackRock $500M Stake Shock – Forbes [T4]
- How Investors Are Reacting To CleanSpark (CLSK) Using Bitcoin Mining Cash To Build AI-Ready Data Centers – simplywall.st [T5]
- London BTC progresses US gold acquisitions – Mining.com.au [T6]
- This Week in Crypto Law (Apr. 26, 2026) – Cryptonews.net [T8]
This report is AI-generated for informational purposes only and does not constitute investment advice. Readers should conduct their own due diligence before making financial decisions.
Important Note / Wichtiger Hinweis:
EN: This report may have been generated using AI. It processes data from publicly available sources. The content is provided for informational purposes only.DE: Dieser Bericht kann mithilfe von KI erstellt worden sein. Dabei werden Daten aus öffentlich zugänglichen Quellen verarbeitet. Die Inhalte dienen ausschließlich Informationszwecken.
* DE: Die ergänzenden Inhalte können KI-generiert sein. EN: The additional content may be AI-generated.