
Listen to the summary
Key Data Snapshot
| Metric | Value | Context |
|---|---|---|
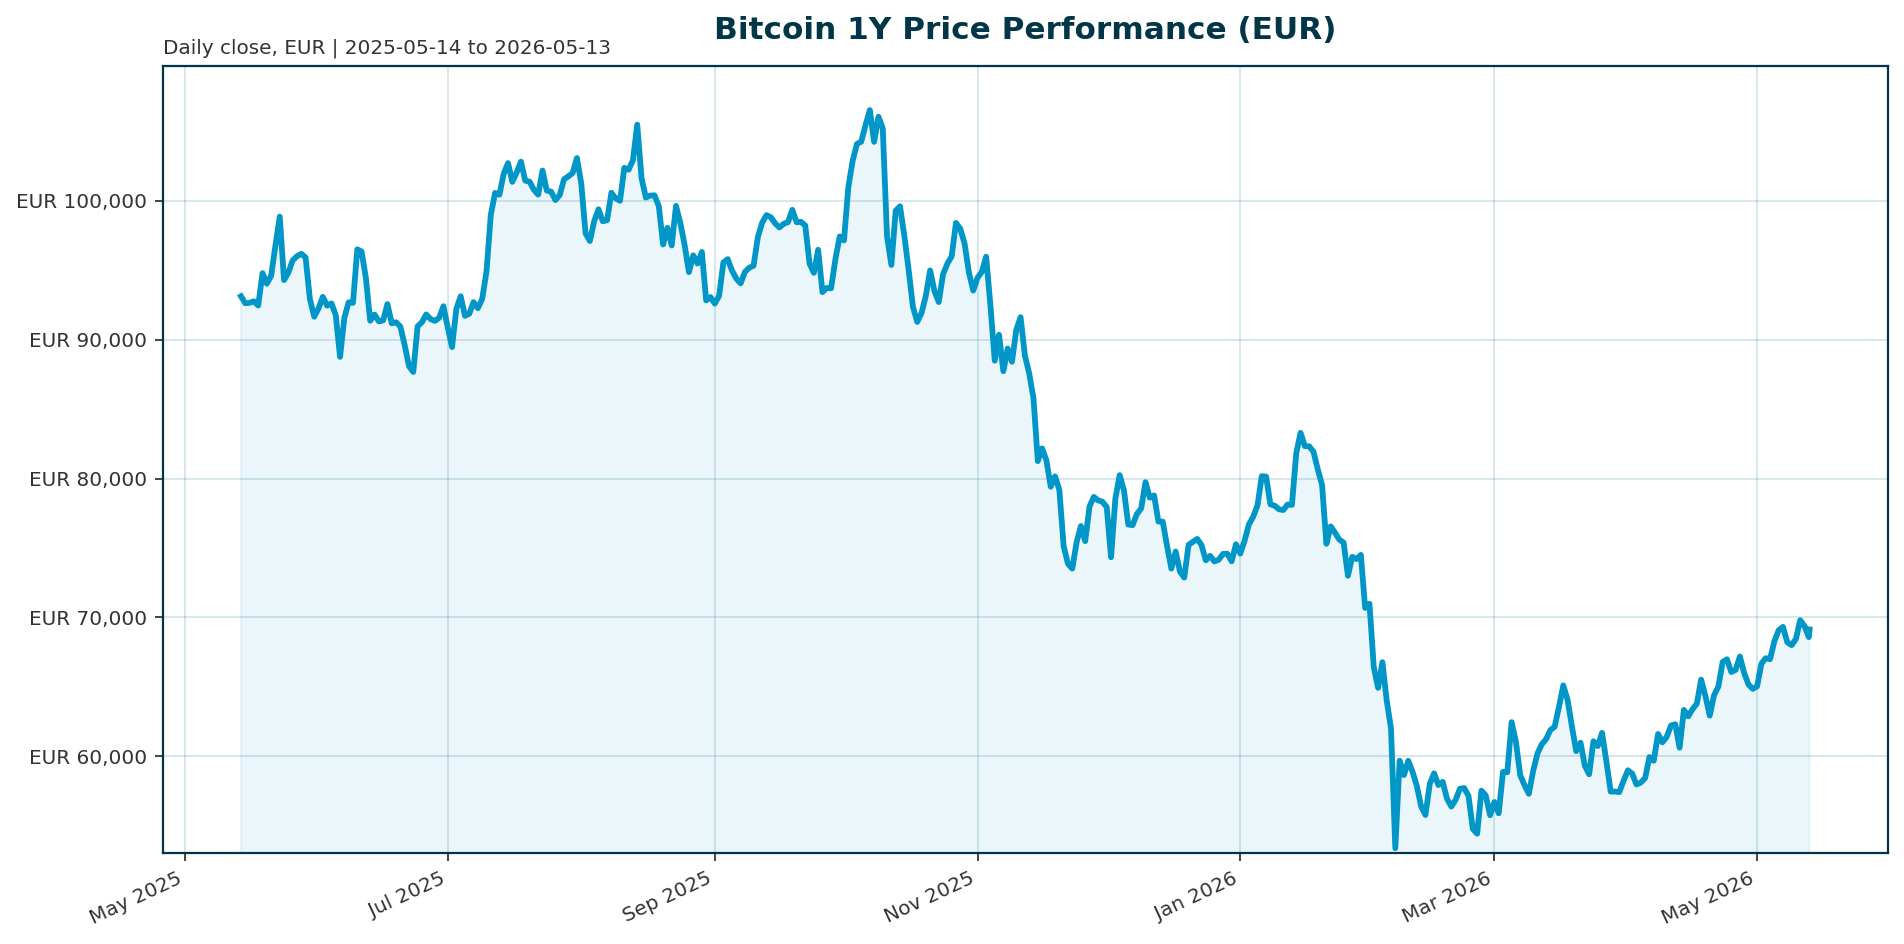
| Price (EUR) | 69,153.00 | Current market price |
| Market Cap (EUR) | 1.39 T | Total market capitalization |
| 24h Volume (EUR) | 27.35 B | Trading volume over 24 hours |
| 30-Day Change | +13.73% | Rally phase |
| 200-Day Change | -27.63% | Bearish structural trend |
| ATH (Oct 2025) | 107,662.00 | Current price is -35.77% below all-time high |
| BTC Dominance | 58.29% | Share of total crypto market cap |
Market Setup
Risk sentiment is neutral to positive while equity momentum is broadly positive, though DACH markets are lagging. Euro yields are mixed at 3.08% for the 10Y, and FX markets show mixed signals with EUR/USD at 1.1743. The Nasdaq Composite leads on a 1-month basis at 13.91%, while the DAX is the weakest 5-day performer at -3.87%. This divergence suggests local capital flight in Europe may be looking for alternative assets, potentially benefiting Bitcoin as a non-correlated store of value.
Investment Thesis
The core investment thesis for Bitcoin centers on the structural transition from speculative trading to strategic institutional allocation. Evidence of this shift is mounting as firms like XBTO launch Digital Asset Allocators, allowing institutions to model portfolios with direct Bitcoin exposure alongside traditional assets [T4]. This move away from purely speculative positioning toward strategic integration suggests a maturing demand curve. Furthermore, the narrative is expanding beyond simple store-of-value to include utility and infrastructure, exemplified by miners like CleanSpark expanding into AI infrastructure while reporting strong April production of 640 Bitcoin [T6].
Bullish Drivers
- Regulatory Tailwinds: The U.S. Clarity Act is viewed as a major moment for the blockchain industry by Pantera Capital, potentially accelerating adoption by providing a clearer regulatory framework for entrepreneurs and investors [T2]. Bitget CEO Gracy Chen echoes this view, suggesting the Act could streamline regulations, making it easier for exchanges to expand in the U.S. market [T8].
- Portfolio Efficiency: New tools like XBTO’s Digital Asset Allocator enable investors to analyze how small Bitcoin allocations impact portfolio efficiency and drawdowns, supporting the argument that crypto can enhance risk-adjusted returns rather than just add volatility [T4].
- Capital Complementarity: The Bitget CEO argues that AI will complement, not compete with crypto for capital, reducing fears of a capital flight from digital assets into artificial intelligence sectors [T8].
Relative Positioning vs Gold and Ethereum
Bitcoin maintains a dominant position within the cryptocurrency ecosystem, holding 58.29% of the total crypto market cap. However, specific price data for Ethereum and Gold was not available in the provided market overview bundle. Without current price benchmarks, a direct valuation comparison against these asset classes cannot be calculated. However, the high dominance suggests that Bitcoin remains the primary vehicle for crypto capital flows, while the ongoing institutionalization of the space implies a potential re-rating relative to traditional assets if adoption continues.
Scenario Framework
- Base Case (Consolidation): The Clarity Act progresses slowly. Bitcoin consolidates between 65,000 EUR and 75,000 EUR, supported by steady institutional inflows via ETFs but hindered by the lingering -27.6% 200-day trend.
- Bull Case (Breakout): Regulatory clarity accelerates. Bitcoin breaks above 75,000 EUR and targets the 90,000 EUR mark, driven by a surge in compliant ETF products and a risk-on environment led by Nasdaq strength.
- Bear Case (Reversion): Regulatory friction increases or macro headwinds deepen. Bitcoin fails to hold 65,000 EUR support, potentially retesting 60,000 EUR as DACH equity weakness spills over into risk assets.
Valuation Discussion
Bitcoin is currently trading at approximately 64% of its October 2025 all-time high of 107,662 EUR. The recent 30-day rally of +13.7% indicates a recovery phase, yet the 200-day change of -27.6% confirms the asset is still in a bearish structural trend. Valuation is currently dictated by liquidity conditions and regulatory sentiment rather than historical multiples. The current price of 69,153 EUR offers a risk-reward balance that favors accumulation for those with a long-term horizon, provided regulatory hurdles do not escalate.
Risks
- Regulatory Uncertainty: The SEC delay on prediction markets ETFs highlights ongoing friction in the regulatory approval process, which could stall institutional entry [T1].
- Macro Credit Risks: Regulators warn of structural risks as private credit expansion outpaces oversight, citing potential vulnerabilities in the broader financial system that could trigger risk-off events [T3].
- Geopolitical Tensions: The current macroeconomic backdrop includes geopolitical tensions and weaker global growth prospects, which could pressure risk assets, including Bitcoin, if investors seek safety.
Appendix
Sources
- SEC delay on prediction markets ETFs echoes a long-fought bitcoin fund battle – CNBC [T1]
- Clarity Act is a ‘major moment’ for the blockchain industry: Pantera Capital – CNBC [T2]
- Regulators warn of structural risks as private credit expansion outpaces oversight – Private Equity Wire [T3]
- XBTO Launches Digital Asset Allocator to Help Institutions Model Multi-Asset Portfolios – The Fintech Times [T4]
- Is CleanSpark’s (CLSK) April Bitcoin Surge Quietly Redefining Its AI Infrastructure Ambitions? – simplywall.st [T6]
- AI will complement, not compete with crypto for capital: Bitget CEO – CNBC [T8]
This report was generated by AI for informational purposes only and does not constitute investment advice. The analysis is based on data available as of the report date and may not reflect real-time market conditions.
Important Note / Wichtiger Hinweis:
EN: This report may have been generated using AI. It processes data from publicly available sources. The content is provided for informational purposes only.DE: Dieser Bericht kann mithilfe von KI erstellt worden sein. Dabei werden Daten aus öffentlich zugänglichen Quellen verarbeitet. Die Inhalte dienen ausschließlich Informationszwecken.
* DE: Die ergänzenden Inhalte können KI-generiert sein. EN: The additional content may be AI-generated.