
Listen to the summary
Key Data Snapshot
| Metric | Value | Context |
|---|---|---|
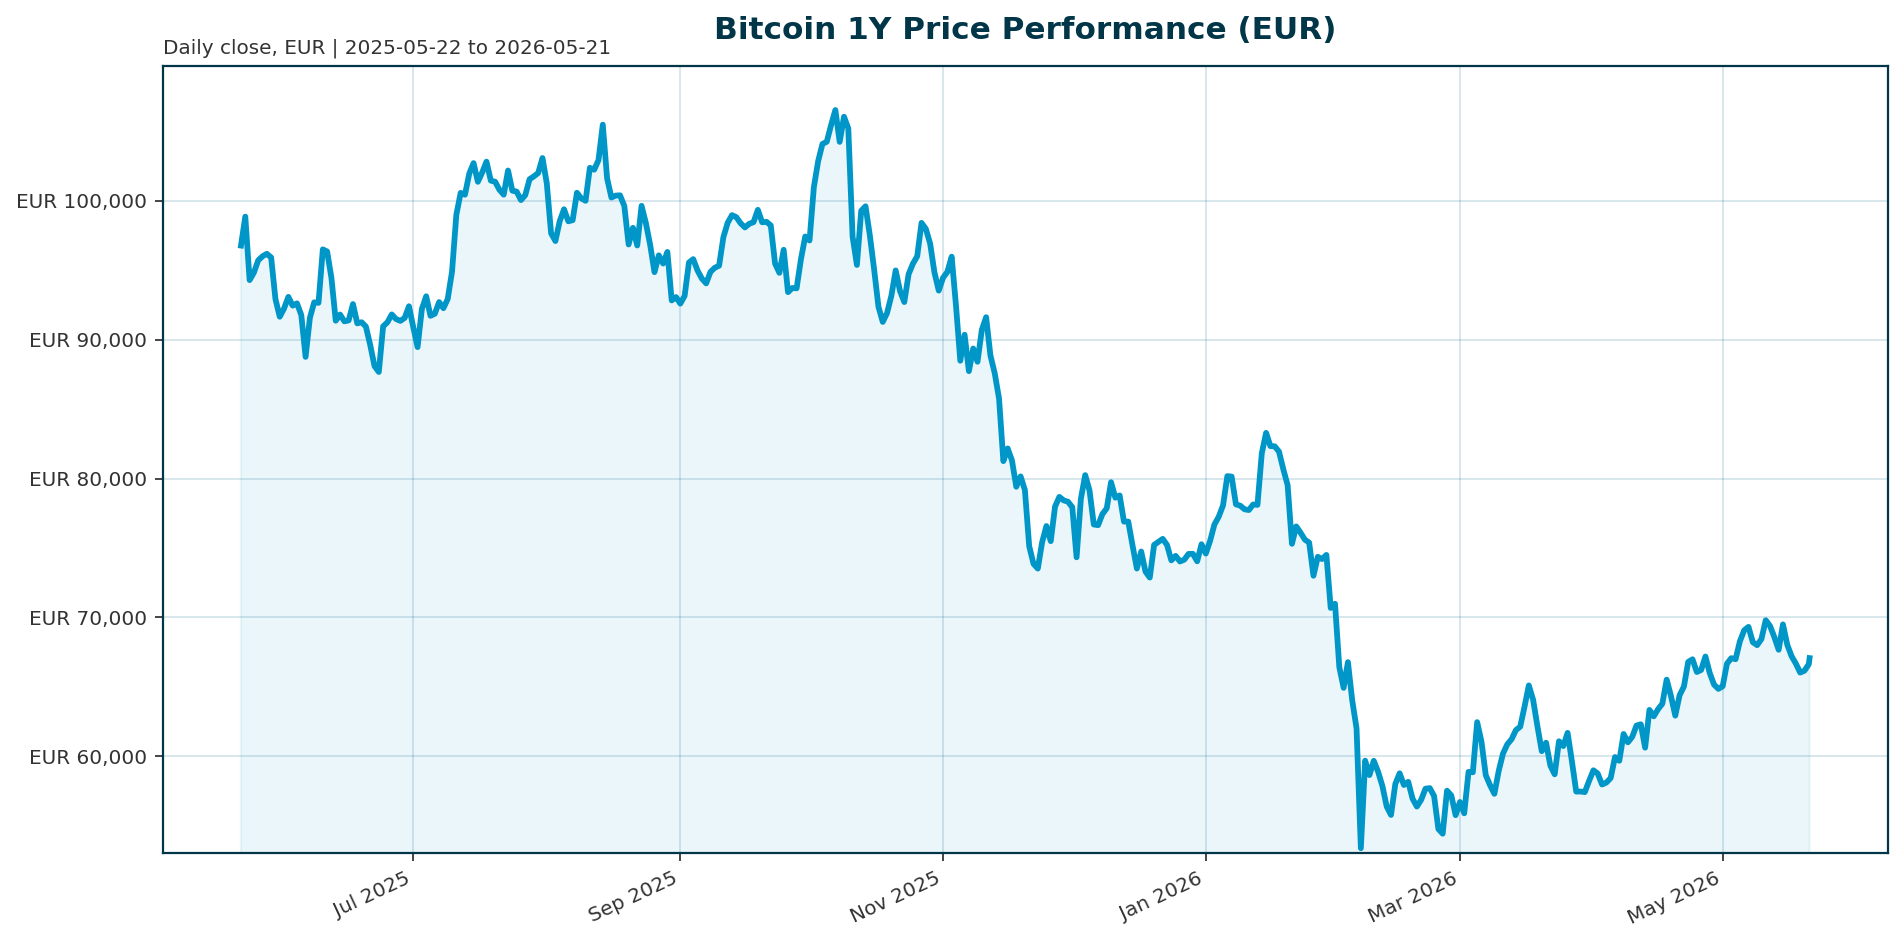
| Price (EUR) | 67,037.00 | Current spot price |
| Market Cap (EUR) | 1.35 T | Global rank 1 |
| All-Time High | 107,662.00 | Oct 2025 (37.7% below ATH) |
| 200-Day Return | -29.33% | Technical drawdown |
| 24h Volume (EUR) | 24.49 B | High liquidity |
Market Setup
Risk sentiment is neutral to positive. The Euro Stoxx 50 leads regional equity performance with a 5-day gain of 1.96%, while the DAX rises 1.15% as DACH markets outperform the weak US Nasdaq Composite (-1.37%). Euro area yields are mixed at 3.22% for the 10Y, and EUR/USD slides -0.29% over the week. This backdrop suggests a regional rotation favoring European risk assets, potentially benefiting Bitcoin as institutional inflows continue.Investment Thesis
Bitcoin is transitioning from a speculative asset to a recognized institutional settlement layer. The primary thesis rests on regulatory clarity and macroeconomic hedging. As the US government shifts toward adopting Bitcoin and establishing a strategic reserve [T2], the asset is increasingly viewed as a hedge against wartime inflation and debt crises. The rise of crypto ETFs acts as a bridge between traditional finance and digital assets, normalizing exposure for major banks like Wells Fargo and Goldman Sachs [T2].Bullish Drivers
Regulatory tailwinds are accelerating. The Senate Banking Committee advanced the Clarity Act in a 15-9 bipartisan vote, signaling a move toward federal regulation [T4]. ETF inflows reached $47.2 billion last year, with 86% of institutional investors forecasting strong inflows for 2026 [T1]. Furthermore, Wall Street giants are aggressively accumulating BTC, with Wells Fargo increasing holdings by 24% and 41% respectively in their ETF portfolios [T2]. The macro environment supports this thesis, with US CPI hitting a three-year high of 3.8% in April 2026, driving demand for inflation hedges [T2].Relative Positioning vs Gold and Ethereum
Bitcoin maintains dominance at 58.24% of the total crypto market cap. While Ethereum serves as the primary smart contract platform, its recent performance has lagged Bitcoin. The narrative of Bitcoin as decentralized settlement infrastructure for AI financial systems differentiates it from ETH [T2]. Compared to Gold, BTC offers higher volatility but higher upside potential in a high-inflation environment, whereas Gold provides stability. The current price action suggests BTC is consolidating below its ATH while waiting for regulatory clarity to trigger the next leg up.Scenario Framework
- Bull Case: Full passage of the Clarity Act combined with a surge in ETF inflows drives a re-rating to previous ATH levels. Bitcoin acts as the primary inflation hedge as stagflation risks persist.
- Base Case: Regulatory clarity is achieved but incremental. ETF inflows remain steady, supporting a consolidation around current levels as the market digests the 200-day drawdown.
- Bear Case: Stagflation fears materialize (probability near 40% per prediction markets [T5]) or regulatory pushback occurs. Bitcoin underperforms equities, testing lower support levels.
Valuation Discussion
Valuation is currently attractive relative to the all-time high. Trading at 62% of the ATH (107,662 EUR), the market is pricing in regulatory uncertainty and the recent 200-day drawdown of -29.33%. However, with ETF assets under management growing rapidly and institutional adoption rising, the current valuation may be discounted. A re-rating to previous ATH levels seems plausible if the Clarity Act passes and institutional inflows accelerate.Risks
- Macro Risk: Stagflation risks remain elevated, potentially forcing central banks to maintain restrictive monetary policy, which could pressure risk assets.
- Regulatory Risk: Despite the Clarity Act progress, ambiguity regarding the definition of digital assets could lead to unexpected enforcement actions.
- Market Structure Risk: A sudden slowdown in ETF inflows could trigger a liquidity crunch, exacerbating the current 200-day drawdown.
Appendix
Sources
- The $14Trillion Pressure Cooker: How Crypto ETF Inflows are Forcing the Regulatory Hand – The Fintech Times [T1]
- What Is Bitcoin? Why Are Wall Street Giants Buying BTC Like Crazy? – TradingKey [T2]
- ‘Biggest bottleneck in the AI buildup’ fuels DRAM ETF to record – CNBC [T3]
- Bitcoin hits $82,000, Coinbase leads crypto stock gains as Clarity act advances – CoinDesk [T4]
- US fund Alpine Fox Capital lists bitcoin mining company Cipher Mining as its largest holding – Bitget [T5]
- 3 ways the pros are trading markets right now, including why JPMorgan downgraded semiconductor stocks – CNBC [T6]
- The bond market is around equilibrium and yields aren’t excessively high yet: Alpine Macro – CNBC [T7]
- AI demand cycle could last a long time for chip stocks, says Seaports Jay Goldberg – CNBC [T8]
This report is AI-generated for informational purposes only and does not constitute investment advice. Always conduct your own research and consult with a qualified financial advisor before making investment decisions.
Important Note / Wichtiger Hinweis:
EN: This report may have been generated using AI. It processes data from publicly available sources. The content is provided for informational purposes only.DE: Dieser Bericht kann mithilfe von KI erstellt worden sein. Dabei werden Daten aus öffentlich zugänglichen Quellen verarbeitet. Die Inhalte dienen ausschließlich Informationszwecken.
* DE: Die ergänzenden Inhalte können KI-generiert sein. EN: The additional content may be AI-generated.