
Listen to the summary
Key Data Snapshot
| Metric | Value |
|---|---|
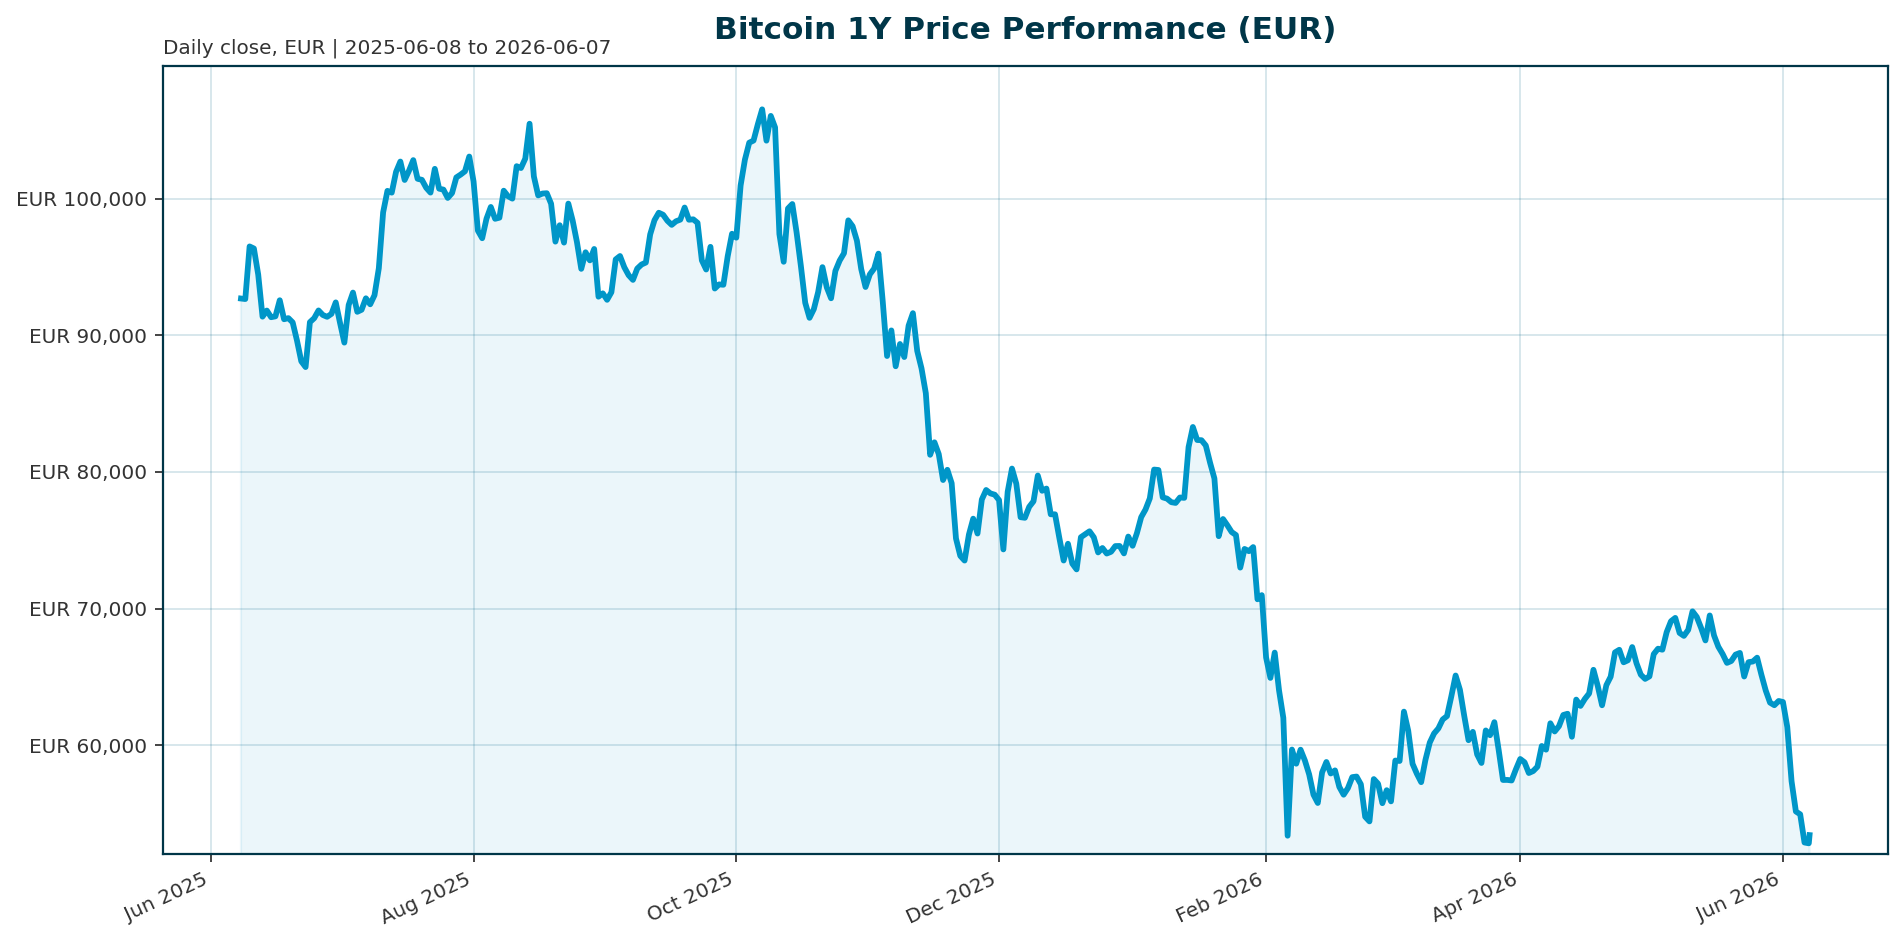
| Price (EUR) | 53,381.00 |
| Market Cap (EUR) | 1,070,846,932,127 |
| 24h Change | +2.20% |
| 7d Change | -15.82% |
| 30d Change | -21.31% |
| 1y Change | -41.80% |
| All-Time High (ATH) | 107,662.00 |
| ATH Drawdown | -50.42% |
| BTC Dominance | 56.05% |
| Total Crypto Market Cap | 1,907,095,113,242 |
Market Setup
Risk sentiment is neutral with Euro yields mixed. The Euro Stoxx 50 leads with a 5-day gain of 0.45%, while the Nasdaq Composite lags with a 5-day drop of 5.09% [T8]. This divergence highlights a bifurcated market where European equities hold up better than US tech, yet capital continues to rotate away from crypto into AI and megacap IPOs. The Euro area AAA 10Y yield stands at 3.07%, providing a backdrop where financing costs remain elevated for speculative assets.Investment Thesis
The core thesis is a “liquidity rotation” from crypto to AI infrastructure and megacap equities. Despite regulatory progress and ETF access, Bitcoin is losing its status as the dominant speculative trade. The asset is currently priced for a “choppy summer” as investors seek yield in AI stocks and stablecoins, leaving Bitcoin to suffer from a lack of catalysts and seasonal weakness.Bullish Drivers
Saylor argues the weakness is a rotation into AI infrastructure rather than a structural failure [T4]. If AI valuations correct or liquidity returns to crypto, Bitcoin could reclaim the 200-day moving average. Additionally, a seasonal bottoming in summer or renewed interest in the CLARITY Act could provide support.Relative Positioning vs Gold and Ethereum
Bitcoin’s market dominance has slipped to 56.05% as stablecoins capture volume [T7]. While Gold remains a safe haven, Bitcoin is underperforming relative to the Nasdaq (which is up 170% in a year vs Bitcoin down 40%) [T7]. Ethereum and altcoins are holding market share, suggesting capital is not flowing into crypto but rather into non-crypto speculative assets.Scenario Framework
- Base Case: Consolidation between €50,000 and €60,000 as liquidity remains tight.
- Bear Case: Re-test of February lows (~€60,000) if ETF outflows exceed $4 billion [T6].
- Bull Case: Reclamation of the 200-day MA and ATH at €107,662 if AI rotation reverses.
Valuation Discussion
Valuations are stretched relative to current flows. The market cap is €1.07T, yet 24h volume is €27B, indicating low liquidity. Derivatives markets show a divergence between leveraged bullish positioning and deteriorating spot demand [T5], suggesting potential for a short squeeze or further de-leveraging.Risks
The CLARITY Act is drifting out of reach [T1]. Negative Coinbase Premium indicates weak demand from US institutions [T5]. Furthermore, financing costs remain elevated, potentially derailing the asset class if yields continue to rise.Appendix
Sources
- Bitcoin is weathering its ugliest week in months as narrative fades and liquidity rotates – CNBC [T1]
- Bitcoin isn’t crashing because of Saylor, it’s losing the momentum trade – CoinDesk [T2]
- Data: Hive Digital sold 331 BTC in the first quarter, reducing its holdings to 150 BTC – WEEX [T3]
- Bitcoin (BTC) isn’t broken, says Strategy’s (MSTR) Saylor – CoinDesk [T4]
- Bitcoin price analysis: BTC could have further room to fall, based on derivatives positioning – CoinDesk [T5]
- Bitcoin price news: BTC appears set for re-test of February’s lows as AI boom draws flood of capital – CoinDesk [T6]
- Bitcoin’s star fades, as investors flock to lustre of AI and megacap IPOs – Reuters [T7]
- Bitcoin trails stocks by most since 2019 as traders get their kicks elsewhere – CNBC [T8]
This report is AI-generated, for informational purposes only, and not investment advice.
Important Note / Wichtiger Hinweis:
EN: This report may have been generated using AI. It processes data from publicly available sources. The content is provided for informational purposes only.DE: Dieser Bericht kann mithilfe von KI erstellt worden sein. Dabei werden Daten aus öffentlich zugänglichen Quellen verarbeitet. Die Inhalte dienen ausschließlich Informationszwecken.
* DE: Die ergänzenden Inhalte können KI-generiert sein. EN: The additional content may be AI-generated.