
Listen to the summary
Key Data Snapshot
| Metric | Value |
|---|---|
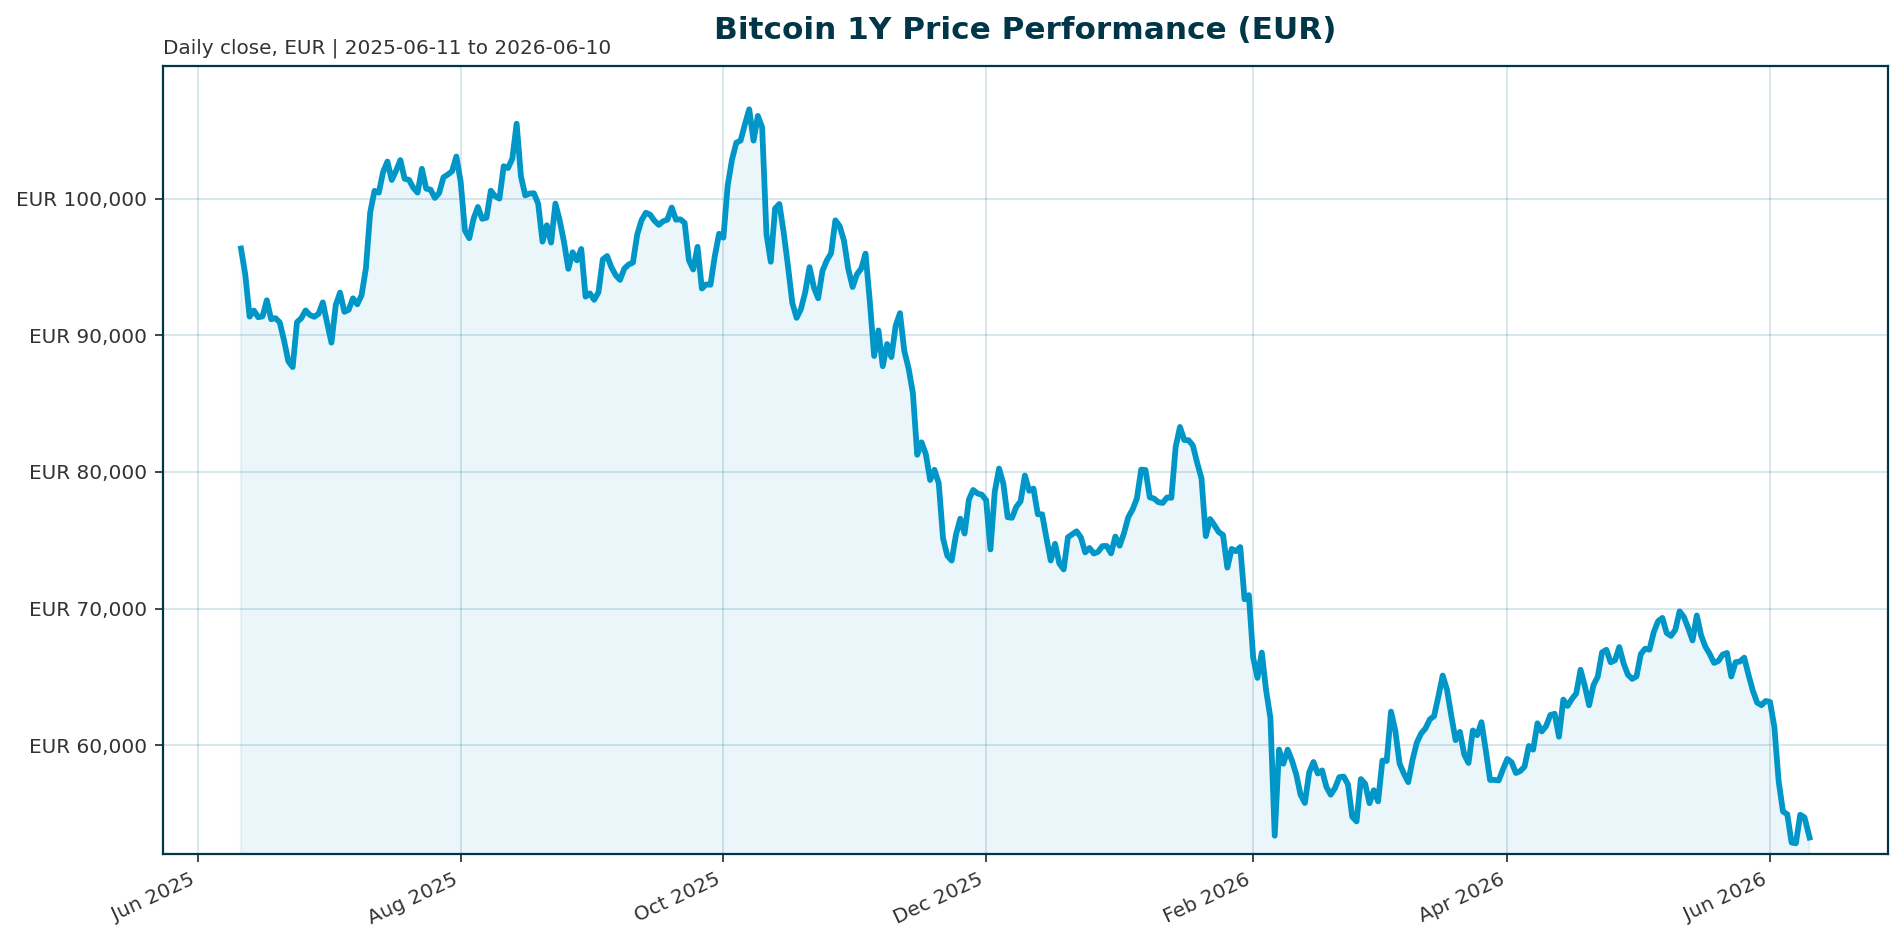
| Price (EUR) | 53,205.00 |
| Market Cap (EUR) | 1.07T |
| 24h Volume (EUR) | 33.51B |
| Change (24h) | -2.41% |
| Change (200d) | -27.39% |
| ATH (EUR) | 107,662.00 (Oct 2025) |
| ATH Change | -50.58% |
| BTC Dominance | 55.95% |
Market Setup
Risk sentiment is neutral to negative as liquidity rotates aggressively away from crypto. The euro area AAA 10Y yield sits at 3.09%, creating a mixed backdrop for non-yielding assets. The FX backdrop shows EUR/USD at 1.1564, weakening over the last five days. Key observations indicate that while DACH equity indicators have held up relatively better (-1.46% 5d) compared to global peers, the Nasdaq Composite is the weakest major index (-4.38% 5d), reflecting a capital rotation into AI infrastructure and away from Bitcoin [T1][T5].Investment Thesis
The fundamental thesis for Bitcoin remains anchored in its fixed supply of 21 million units and its role as a non-sovereign store of value. Institutional adoption, facilitated by spot ETFs, has matured into the primary driver of price action, with Citi noting these flows explain approximately 45% of weekly return variation. Despite current headwinds, historical precedent suggests Bitcoin retains resilience during rate hikes, having survived previous “winters” in 2018 and 2022. The current weakness is viewed structurally as a liquidity rotation rather than a failure of the asset, provided the “digital gold” scarcity narrative persists.Bullish Drivers
Regulatory Clarity (CLARITY Act): The stalled progress on the CLARITY Act remains the single largest catalyst for renewed institutional inflows. Passage of the bill would remove a significant overhang and likely re-ignite demand from traditional finance participants [T1]. Product Innovation & ETF Growth: New financial products are expanding the entry points for investors. The rapid launch of Hyperliquid ETFs by firms like Bitwise and 21shares demonstrates that Wall Street is actively creating vehicles for exposure to decentralized derivatives markets, potentially accelerating mainstream adoption [T3]. AI Rotation Reversal: The current capital flight into AI infrastructure stocks (up 170% in the last year) is a temporary rotation. As the AI narrative matures and valuations become stretched, capital is expected to rotate back into high-beta assets like Bitcoin, seeking asymmetric returns [T2][T4].Relative Positioning vs Gold and Ethereum
Bitcoin is losing market share to other asset classes. BTC dominance has slipped to 56.9% from 63% a year ago. Stablecoins now account for nearly 13% of the crypto market, up from 7%, capturing significant trading volume that previously flowed into BTC and ETH. Ethereum has maintained relatively steady market share, suggesting it is outperforming Bitcoin in this specific liquidity rotation. While Gold remains the traditional safe haven, the current data suggests investors are moving into cash-like stability (stablecoins) rather than hard assets.Scenario Framework
Base Case (Consolidation): BTC holds support levels between 55,000 and 60,000 EUR. ETF outflows decelerate as the AI rotation peaks and institutional sentiment stabilizes. Price action drifts sideways awaiting regulatory clarity. Bull Case (Recovery): The CLARITY Act passes or the AI trade cools, triggering a reversal in ETF flows. BTC reclaims the 70,000 EUR level and tests the 100,000 EUR psychological barrier, potentially reclaiming its ATH. Bear Case (Breakdown): BTC breaks critical support below 55,000 EUR. Continued heavy ETF outflows and the unwinding of the digital-asset treasury (DAT) premium accelerate, leading to a deeper correction toward 45,000 EUR.Valuation Discussion
Bitcoin is currently priced at a significant discount to its all-time high, trading at roughly 50% of its ATH. The market cap stands at 1.07T EUR. The financing cost backdrop is a key valuation factor; with Euro area yields at 3.09%, the opportunity cost of holding a non-yielding asset remains elevated. However, the asset’s correlation with rate hikes has historically been strong, and the current divergence between a rallying Nasdaq and crashing BTC suggests that rate sensitivity is being superseded by a thematic rotation into AI.Risks
Liquidity Rotation Risk: The AI trade is currently the dominant narrative. If capital continues to rotate into AI infrastructure and megacap IPOs like SpaceX, Bitcoin could face sustained outflows [T4]. Regulatory Stagnation: Failure to pass the CLARITY Act could freeze institutional inflows and keep the asset in a regulatory limbo, depressing valuations [T1]. Technical Breakdown: The removal of the “marginal buyer” (Strategy) and the unwinding of the DAT premium have broken previous support levels. A break below 55,000 EUR could trigger a cascade of forced liquidations.Appendix
Sources
- Bitcoin is weathering its ugliest week in months as narrative fades and liquidity rotates – CNBC [T1]
- Bitcoin (BTC) isn’t broken, says Strategy’s (MSTR) Saylor – CoinDesk [T2]
- Bitcoin is cratering, but a new Wall Street crypto hype is on the rise – CNBC [T3]
- Bitcoin’s star fades, as investors flock to lustre of AI and megacap IPOs – Reuters [T4]
- Bitcoin trails stocks by most since 2019 as traders get their kicks elsewhere – CNBC [T5]
- BTC price updates: Bitcoin could fall to $60,000, Zcash plunges 37% – CoinDesk [T6]
- Bitcoin’s brutal sell-off sparks a flurry of trading in related stocks, including one big bullish bet – CNBC [T7]
This report is AI-generated for informational purposes only and does not constitute investment advice. The views expressed are those of the AI model GLM 4.7 Flash and should not be taken as financial guidance. Investors should conduct their own due diligence before making investment decisions.
Important Note / Wichtiger Hinweis:
EN: This report may have been generated using AI. It processes data from publicly available sources. The content is provided for informational purposes only.DE: Dieser Bericht kann mithilfe von KI erstellt worden sein. Dabei werden Daten aus öffentlich zugänglichen Quellen verarbeitet. Die Inhalte dienen ausschließlich Informationszwecken.
* DE: Die ergänzenden Inhalte können KI-generiert sein. EN: The additional content may be AI-generated.