
Listen to the summary
Key Data Snapshot
| Metric | Value | Change (Period) |
|---|---|---|
| Price (EUR) | 52,154.00 | -0.80% (24h) |
| Market Cap (EUR) | 1.045 T | -0.76% (24h) |
| 24h Volume (EUR) | 26.19 B | N/A |
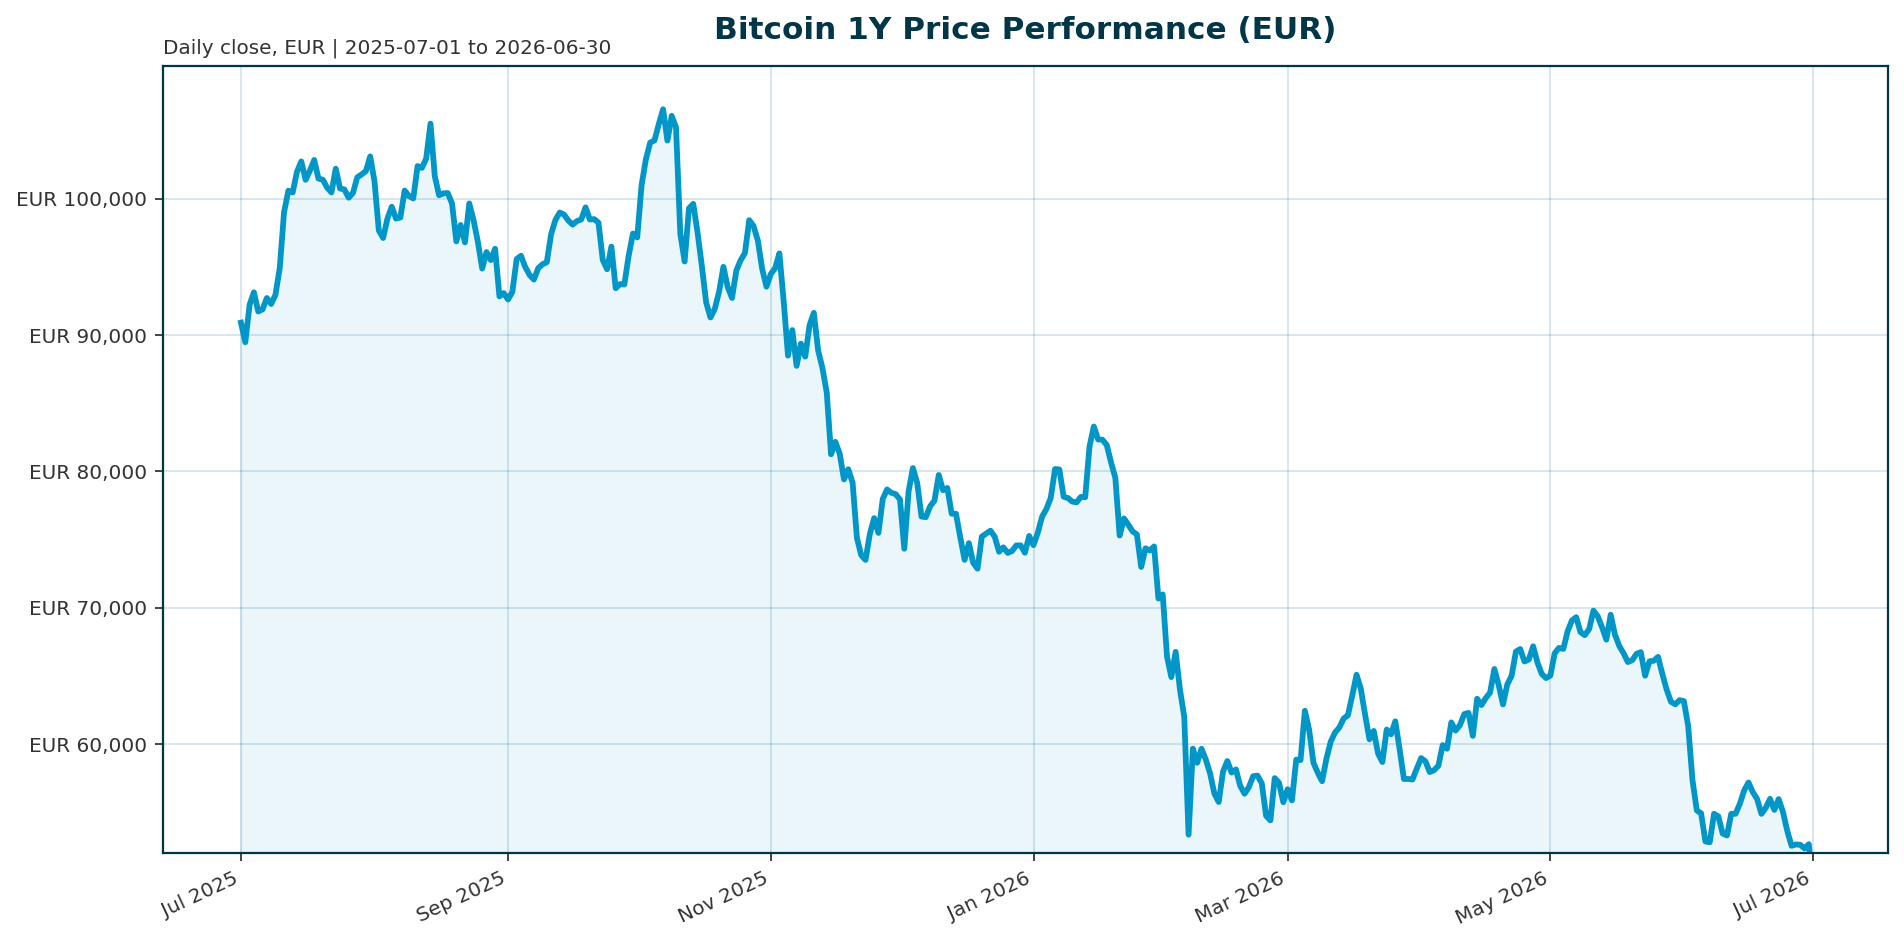
| Year-to-Date | N/A | -43.68% |
| 200-Day Moving Avg | N/A | -33.69% |
| All-Time High | 107,662.00 | -51.56% |
| BTC Dominance | 55.55% | N/A |
Market Setup
Risk sentiment is neutral with equity momentum mixed and the DACH region lagging global peers. The euro area yield curve is mixed, while FX markets are choppy. Key observations highlight Nikkei 225 strength versus DACH weakness and rising bond ETF flows as investors hunt for yield. This macro backdrop suggests a rotation away from non-yielding assets and the “debasement trade” into traditional fixed income, pressuring Bitcoin in the short term.Investment Thesis
Bitcoin remains in a deep correction phase, down 43.7% year-to-date and 51.6% from its October 2025 all-time high. The current price action is driven by a confluence of negative ETF flows, regulatory uncertainty regarding the U.S. Clarity Act, and a macro shift away from the debasement narrative. However, the thesis posits that this represents a liquidity-driven correction rather than a structural failure. Despite the “ponzi scheme” rhetoric surrounding MicroStrategy, the underlying asset remains below its long-term 200-week moving average, presenting a potential accumulation zone for long-term holders. The asset continues to serve as a high-beta proxy for AI and tech rotation, even if it currently lags U.S. equities.Bullish Drivers
The primary catalyst for a reversal is regulatory clarity. The bipartisan Clarity Act, with a July 4 deadline, is a critical inflection point; its passage would likely trigger a regulatory relief rally [T2]. On the technical side, Bitcoin has recently outperformed precious metals, gaining roughly 30% against gold since February, suggesting it remains a viable inflation hedge within a broader risk-on environment [T6]. Additionally, the AI trade continues to draw capital, and Strategy (MSTR) has signaled it is not a forced seller, which could stabilize sentiment if the preferred equity panic subsides [T2].Relative Positioning vs Gold and Ethereum
Bitcoin has recently decoupled from the traditional debasement trade, lagging gold and silver in 2025 while they rallied aggressively. However, since February, it has outperformed both metals, gaining more than 55% against silver and roughly 30% against gold [T6]. This suggests a reversion to form where BTC acts as the premier digital store of value. Ethereum is currently trading under $1,570, significantly lagging Bitcoin and struggling with its own technical breakdowns [T1]. Conversely, Bitcoin is lagging U.S. equities, which are driven by semiconductor and memory stock momentum, indicating capital rotation out of crypto and into traditional tech.Scenario Framework
- Bull Case: The Clarity Act passes and regulatory uncertainty dissipates. ETF inflows resume, and the AI trade re-enters crypto. Price targets 70,000 EUR.
- Base Case: Bitcoin consolidates in the 50,000 to 60,000 EUR range. The Grayscale $3B sell-off is absorbed by market makers, and the asset holds above the 200-week moving average.
- Bear Case: Regulatory deadlock persists, and Grayscale completes the $3B sell-off. Forced liquidations trigger a cascade below 50,000 EUR, testing yearly lows.
Valuation Discussion
Valuation metrics are distorted by the MicroStrategy proxy effect. The preferred equity of Strategy is trading at 80 cents on the dollar, and the stock is below $100, fueling “ponzi scheme” fears that discount Bitcoin’s intrinsic value [T2]. However, this reflects extreme short-term sentiment rather than on-chain fundamentals. Bitcoin dominance remains robust at 55.5%, indicating that while capital is rotating out of BTC, it is not leaving the crypto ecosystem entirely. The current P/B ratio is likely compressed due to the MSTR contagion, potentially offering value for long-term holders if the regulatory cloud lifts.Risks
The most significant risk is regulatory failure. Donald Trump’s refusal to sign the housing bill, which included a CBDC ban, raises doubts about his willingness to sign the Clarity Act, which is essential for institutional confidence [T2]. Liquidity risks are elevated with record ETF outflows of $6.4B over 30 days and a potential $3B sell-off by Grayscale to meet cash obligations [T3][T5]. Furthermore, a softening labor market and surging bond ETF flows could continue to pressure non-yielding assets like Bitcoin as investors prioritize yield [T7].Appendix
Sources
- 5 Market Signals Reveal How AI Stocks, Oil and Bitcoin Shook Wall Street – Bitcoin News [T1]
- The ‘Ponzi Scheme’ Is Collapsing—Bitcoin Suddenly Braced For A Massive Price Crash – Forbes [T2]
- Bitcoin crashes, odds turn darker as MSTR, APLD lead crypto-stocks bloodbath – Seeking Alpha [T3]
- Bitcoin remains below key onchain and technical levels, leaving it in no man’s land – CoinDesk [T4]
- Grayscale strategy team to sell $3B in Bitcoin to meet cash obligations – Crypto Briefing [T5]
- Gold, silver and bitcoin tumble as debasement trade unwinds – CoinDesk [T6]
- Bond ETF flows surge in hunt for yield: ‘Market sniffing out something here,’ says BlackRock exec – CNBC [T7]
- ETFs lead growth in loan fund AUM as outlook on lending rates shifts – PitchBook [T8]
This report is AI-generated for informational purposes only and does not constitute investment advice. The data presented is based on market information available at the time of generation and may not reflect real-time market conditions.
Important Note / Wichtiger Hinweis:
EN: This report may have been generated using AI. It processes data from publicly available sources. The content is provided for informational purposes only.DE: Dieser Bericht kann mithilfe von KI erstellt worden sein. Dabei werden Daten aus öffentlich zugänglichen Quellen verarbeitet. Die Inhalte dienen ausschließlich Informationszwecken.
* DE: Die ergänzenden Inhalte können KI-generiert sein. EN: The additional content may be AI-generated.