
Watch the video
This player shows only the Bitcoin chapter of the daily altii market briefing. Watch the full video on tube.altii.de.
Key Data Snapshot
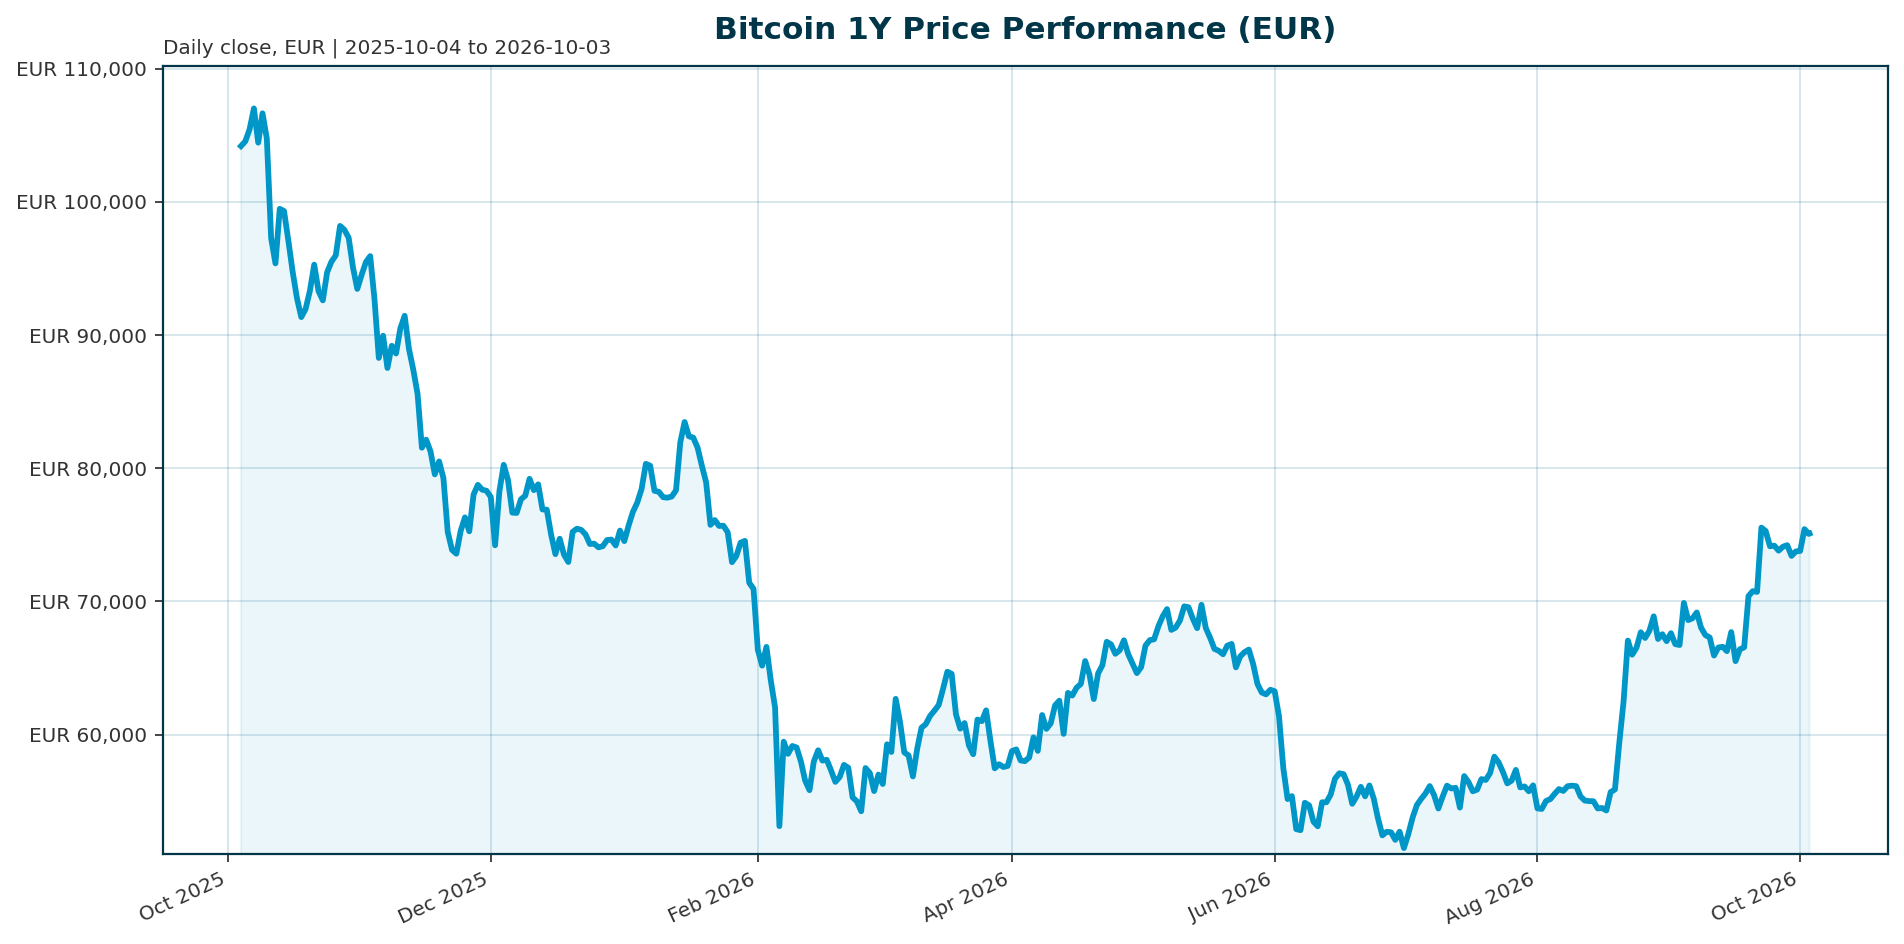
| Metric | Value | Change |
|---|---|---|
| Price (BTC/EUR) | EUR 75,195 | -0.98% (24h), +0.81% (7d), +4.19% (14d) |
| 30d / 200d / 1Y change | +8.88% / +12.58% / -29.67% | Recovery within a 1-year drawdown regime |
| 24h range | EUR 74,527 to EUR 77,358 | -0.98% close within range |
| Market cap | EUR 1.51tn | -0.93% (24h) |
| 24h volume | EUR 37.9bn | ~2.51% of market cap (37,911,948,615 / 1,510,874,071,707) |
| Fully diluted valuation | EUR 1.51tn | Equals market cap; see Appendix data note on FDV anomaly |
| Supply | 20,092,646 of 21,000,000 BTC (95.68% of cap) | ~907,354 BTC remaining issuance |
| All-time high | EUR 107,662 (2025-10-06) | -30.16% distance: (75,195 / 107,662 – 1) x 100 |
| BTC dominance | 58.72% | Total crypto market cap EUR 2.57tn |
| Market cap rank | 1 | Core allocation within crypto |
Momentum is two-sided: positive 7d/14d/30d returns against a deeply negative 1-year return (-29.67%). The spread between 30d (+8.88%) and 1Y (-29.67%) is roughly 39 percentage points, quantifying the recovery-versus-drawdown barbell. The current snapshot reflects a post-correction consolidation phase.
Market Setup
Cross-asset overview: Risk sentiment is neutral and equity momentum is mixed. DACH indicators average -2.38% over 5 days versus +0.85% for global equity indicators, with the ATX the weakest performer at -4.19% and the Nikkei 225 the strongest at +3.69%. Rates show euro yields mixed with curve steepening: the euro area AAA 10Y yield sits at 3.59% (-2.3bp over 5 days but +64bp YTD), the 2Y is at 3.11% (+99.8bp YTD), and the 10Y-2Y spread stands at 48.6bp. The euro is broadly weaker, with EUR/USD at 1.1294 (-0.63% over 5 days, -3.88% YTD). These observations frame, but remain subordinate to, the Bitcoin analysis below.
For BTC specifically, the rates backdrop cuts both ways. The steepening euro curve and the year-long rise in AAA yields (+64bp at 10Y, +100bp at 2Y YTD) raise the opportunity cost of a non-yielding asset. The US side is a more acute headwind: US Treasury yields have surged to new highs as liquidity tightens, with higher yields making institutional buyers more selective because government debt now offers a stronger return profile [T3]. A weaker euro partially cushions the EUR-quoted price against USD-priced downside but complicates direct comparisons against USD-based technical levels from sources; $98,000 and $82,000 references translate to roughly EUR 86,800 and EUR 72,600 at EUR/USD 1.1294, approximate only.
Investment Thesis
Bitcoin has transitioned from a halving-cycle-driven speculative asset into an ETF- and macro-led allocatable asset whose marginal price is set by regulated fund flows. Three structural facts anchor this thesis. First, ETF flows now function as Bitcoin’s leading macro indicator: record Q4-2025 outflows from US-listed BTC and ETH ETFs coincided with the break of $98,000 support and a retest of the low $90,000 range [T1]. Second, continuous institutional flows have displaced the four-year halving cycle as the primary valuation driver [T4]. Third, the scale of institutional absorption is large: 6.7 million BTC sat across ETFs, exchanges, and treasuries at end-2025, which Glassnode labeled the “institutional supply era” [T1].
The demand channel transmits in both directions. Late August 2026 delivered $1.92bn in weekly ETF inflows with IBIT dominant, positioning that read as anticipatory rather than reactive [T5]. June 2026, by contrast, saw a record outflow streak above $2bn that pushed BTC toward a key psychological zone [T7]. Realized volatility compressed from 84% to 43%, evidence of institutionalization and of a larger addressable allocation base for EUR-based allocators [T1]. The investment implication: BTC is now a flow-driven, macro-sensitive allocation whose downside risk is no longer halving-cycle mechanics but the synchronization of ETF outflows with rising sovereign yields.
Bullish Drivers
- Regulated demand depth: Institutional entities, including ETFs, governments, and public and private companies, hold approximately 18.5% of the 21 million coin cap, roughly 3.89 million BTC (0.185 x 21,000,000) [T6]. IBIT became the fastest ETF in history to reach $10bn AUM, in 49 trading days [T6].
- Flow momentum: $1.92bn in weekly inflows in late August 2026, IBIT-dominant, indicates positioning ahead of upside rather than reaction to it [T5]. May 2026 recorded a $467m single-day net inflow, the fourth consecutive positive day, and more recently BTC ETFs posted six consecutive trading days of net inflows including a $190.65m single day, attracting the largest share of ETF capital versus ETH’s $66.01m (evidence from a social media post, lower evidentiary weight) [T8].
- Structural adoption pipeline: Corporate treasury holdings are projected to surpass $250bn and more than 100 new crypto-linked ETFs are expected, deepening the regulated wrapper ecosystem [T2].
- Regulatory catalysts: The US CLARITY Act would establish a federal market-structure framework and could unlock broader institutional participation if passed; Hong Kong’s Stablecoins Ordinance sets a global benchmark for prudentially compatible tokenization [T2].
- Scarcity mechanics: 95.68% of the 21m cap is already mined; remaining issuance of ~907,354 BTC limits new supply irrespective of demand cycles.
The counter-scenario: adoption may plateau into a two-sided flow environment where inflows and outflows alternate without breaking the structural trend, normalizing but not reversing the institutionalization [T7].
Relative Positioning vs Gold and Ethereum
Current gold and Ethereum price levels are unavailable in the report dataset; positioning therefore relies on flow-share and regime evidence rather than live cross-asset pricing.
Versus gold: In 2025, Bitcoin lagged traditional assets including gold and bonds despite institutionalization, a reminder that BTC remains a high-beta corner of global markets [T1]. Rising sovereign yields strengthen the relative appeal of gold and government debt against a non-yielding, volatile asset, and institutional buyers become more selective as yields rise [T3]. In a risk-off rotation with rising rates, gold outcompetes BTC; in a risk-on normalization, BTC’s compressed volatility (43% versus a historical 84%) narrows the diversification gap to gold while retaining higher return potential [T1]. For EUR allocators, the weaker euro (EUR/USD 1.1294, -3.88% YTD) affects both assets’ EUR-quoted returns and should not be ignored in benchmark comparisons.
Versus Ethereum: BTC attracts the largest share of ETF capital: $190.65m versus ETH’s $66.01m on the most recent cited single day, with BTC on six consecutive positive days versus ETH’s five [T8]. BTC dominance of 58.72% confirms BTC remains the core allocation within crypto. A BTC-first allocation captures the deepest regulated liquidity, with ETH as the higher-beta satellite.
Competitive frame: BTC also competes for capital against AI and other high-growth equity themes that currently captivate institutional attention [T7].
Scenario Framework
Qualitative probabilities; 6 to 12 month horizon. Current price EUR 75,195; ATH EUR 107,662.
- Bull case: The ETF inflow streak resumes sustainably and the US CLARITY Act passes [T2]. Flows reassert dominance and BTC retests the prior high region near EUR 107,662; euro weakness adds a tailwind for EUR-quoted returns. Consistent with the August 2026 pattern of $1.92bn weekly inflows anticipating upside [T5].
- Base case: Rangebound consolidation, roughly EUR 70,000 to 85,000, as flows stay two-sided and yields hover at elevated levels. The June 2026 outflow streak above $2bn [T7] and the late-August inflow surge [T5] bracket this range; the market has demonstrated it can produce both within weeks. Euro AAA 10Y near 3.59% keeps opportunity cost elevated but not prohibitive.
- Bear case: Renewed outflow streaks combined with rising real yields push BTC below recent support. This repeats the Q4-2025 pattern, where record ETF outflows coincided with the $98,000 break (approximately EUR 86,800) and more than $1trn in crypto market value was erased as BTC fell nearly 30% from peak [T1]. The US Treasury buyback program beginning in September is an unresolved variable: whether inflows hold once it starts will likely determine the next leg [T5].
Watch items: weekly ETF net flow prints, the CLARITY Act legislative calendar, euro area AAA 10Y trend, and EUR/USD direction.
Valuation Discussion
Bitcoin’s valuation anchors are scarcity-based rather than cash-flow-based. Circulating supply of 20,092,646 BTC represents 95.68% of the 21 million cap, so annualized new issuance is immaterial relative to institutional flow scale; marginal demand, not marginal supply, clears price. Institutional custody absorbs supply overhang: ~18.5% of the cap in institutional hands [T6] and 6.7 million BTC across ETFs, exchanges, and treasuries at end-2025 under broader definitions that include exchanges [T1]. The definitional gap between these figures (~3.89m versus ~6.7m BTC) reflects exchange balances and should not be read as a contradiction.
Flow-implied valuation cuts the other way: the regime is flow-dependent. The Q4-2025 correction erased more than $1trn in crypto market value when the ETF demand channel weakened [T1], demonstrating that the scarcity premium compresses when regulated flows reverse. Directionally, the current EUR 1.51tn market cap sits well below the level implied by the pre-correction peak, leaving mean-reversion upside toward the EUR 107,662 ATH (-30.16% gap) as one anchor and the 30-day recovery of +8.88% as a momentum anchor. We deliberately avoid a single-point target: in a flow-set price regime, valuation ranges are more honest than point estimates.
Risks
- Macro and opportunity cost: US Treasury yields at new highs with tightening liquidity raise the opportunity cost of holding a volatile, non-yielding asset; institutional buyers become more selective as government debt improves its return profile [T3]. Euro area yields up 64bp YTD at the 10Y point reinforce the same pressure for EUR-based allocators.
- Flow regime fragility: The ETF channel transmits drawdowns as efficiently as rallies; record outflow streaks above $2bn in June 2026 show the burden of proof sits with bulls to demonstrate slowing outflows and buyers at lower levels [T7].
- Policy timing risk: Uncertainty over whether inflows hold once the US Treasury bond buyback program begins in September [T5]; the CLARITY Act may pass late or in weakened form [T2].
- Crowded growth competition: Bitcoin must compete for capital in a market increasingly captivated by AI and other high-growth themes [T7].
- Residual high-beta character: Even in the institutional era, BTC lagged gold and bonds in 2025 and erased more than $1trn in market value in a single quarter; institutionalization lowers volatility but does not remove drawdown risk [T1]. Strong ETF inflows do not guarantee rising prices given leverage, macro data, and sentiment shifts [T8].
- Data limitations: No gold or Ethereum price levels in the dataset; no ETF flow print for the report week itself (most recent evidence dates from June to late August 2026); the FDV field equals market cap in the bundle, whereas a standard FDV at the 21m cap would be higher (approximately 1.045x: 21,000,000 / 20,092,668); the 84%-to-43% volatility compression is as of end-2025 and may have shifted; source T8 is a social media post with lower evidentiary weight.
Appendix
Data Notes
- Bundle generated 2026-10-03T04:15:21Z; market data retrieved 2026-10-03T04:15Z; market overview data as of 2026-10-01 (rates) and 2026-10-02/03 (equities, FX).
- FDV anomaly: the bundle reports FDV equal to market cap (EUR 1.51tn). Standard FDV at the 21m max supply would be approximately EUR 1.58tn (1,510,874,071,707 x 21,000,000 / 20,092,668). The field is reported as provided and flagged.
- USD levels from sources ($98,000, $82,000, low $90,000s) are translated to EUR at EUR/USD 1.1294 and labeled approximate.
- Institutional footprint reconciliation: ~18.5% of cap (~3.89m BTC, institutional entities only [T6]) versus 6.7m BTC across ETFs, exchanges, and treasuries (broader definition including exchange balances [T1]).
- Glossary: BTC dominance is Bitcoin’s share of total crypto market cap; FDV is price multiplied by max supply; the ECB AAA yield curve reflects euro area central government bonds with the highest credit rating; ETF net flow is subscriptions minus redemptions across US-listed spot products.
Sources
- [T1] Crypto Market 2025: Year-End Review & Expert Insights. tradingview.com
- [T2] The altii-BTC-Report 2026-10-02. altii.de
- [T3] US Treasury yields surge to new highs as liquidity tightens, pushing Bitcoin back below $82,000 resistance. cryptoslate.com
- [T4] Bitcoin Price Faces a Pivotal Shift: New Market Structure, Institutional Funds, and Macroeconomics Now Drive Value. cryptorank.io
- [T5] Bitcoin ETF Inflows Surge to $1.92 Billion Last Week. cryptonomist.ch
- [T6] The End of Bitcoin’s Four-Year Cycle? How ETFs and Institutions Are Reshaping the Market. wolfandco.com
- [T7] Bitcoin Opens June Under Pressure as ETF Outflows Cross $2B. hedgeco.net
- [T8] Institutional Money Is Still Flowing (social media post). facebook.com
Disclaimer
This report is AI-generated and for informational purposes only. It does not constitute investment advice, a recommendation, or an offer to buy or sell any security or asset. Data may be incomplete or inaccurate; readers should verify figures independently and consult a licensed advisor before making investment decisions.
Important Note / Wichtiger Hinweis:
EN: This report may have been generated using AI. It processes data from publicly available sources. The content is provided for informational purposes only.DE: Dieser Bericht kann mithilfe von KI erstellt worden sein. Dabei werden Daten aus öffentlich zugänglichen Quellen verarbeitet. Die Inhalte dienen ausschließlich Informationszwecken.
* DE: Die ergänzenden Inhalte können KI-generiert sein. EN: The additional content may be AI-generated.