
Watch the video
This player shows only the Bitcoin chapter of the daily altii market briefing. Watch the full video on tube.altii.de.
Key Data Snapshot
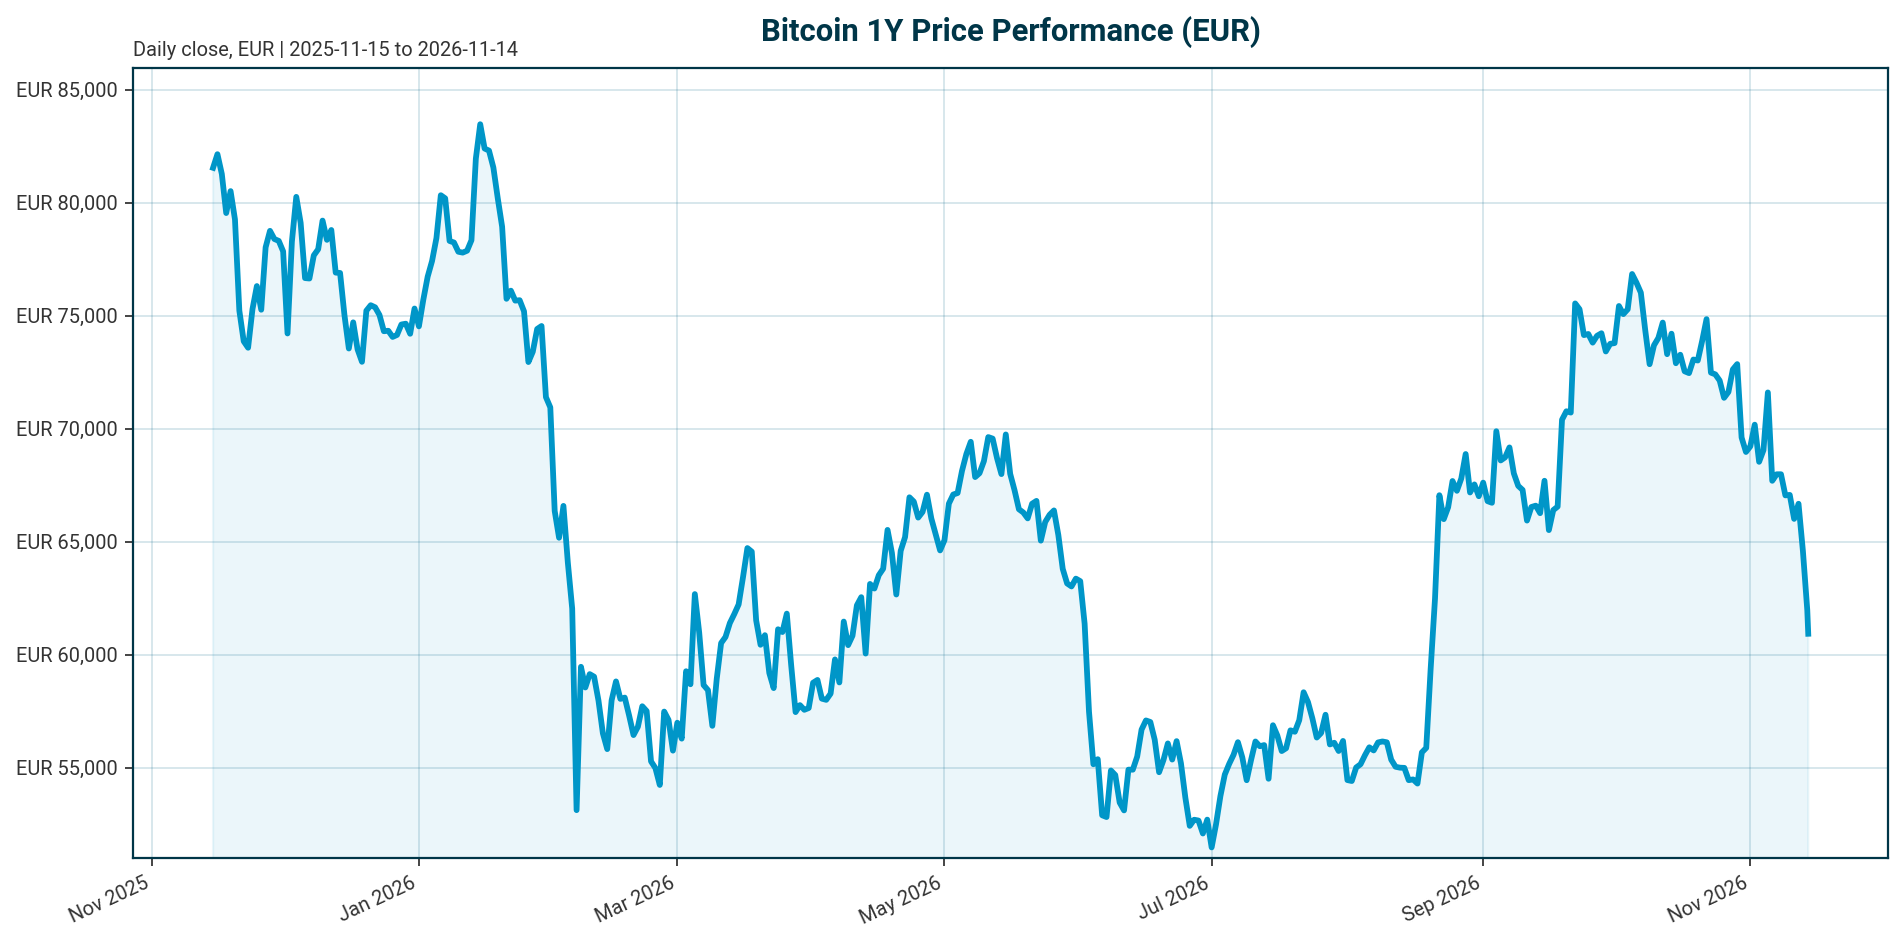
Bitcoin (BTC) trades at EUR 60,921 as of 14 November 2026 (data retrieved 05:15 UTC). The 24-hour range spans EUR 60,318 to EUR 63,541. Momentum is negative across every measured horizon from 24 hours to one year.
| Metric | Value |
|---|---|
| Price (EUR) | 60,921 |
| Change 1h / 24h | +0.49% / -1.90% |
| Change 7d / 14d | -11.58% / -13.04% |
| Change 30d / 200d | -17.05% / -12.73% |
| Change 1y | -32.36% |
| Market cap (EUR) | 1.225 trillion (rank 1) |
| Market cap change 24h | -2.21% (EUR -27.68 billion) |
| 24h volume (EUR) | 34.73 billion |
| BTC dominance | 58.79% of EUR 2.086 trillion total crypto market cap |
| Circulating / total supply | 20,111,659 BTC (95.77% of the 21,000,000 cap) |
| Fully diluted valuation | EUR 1.225 trillion (equals market cap) |
| All-time high | EUR 107,662 (6 October 2025); current price -43.41% below |
| All-time low | EUR 51.30 (4 July 2013) |
Key calculations: recovery to the ATH requires (107,662 / 60,921) – 1 = +76.7%. Turnover ratio: 34.73 billion / 1,225.35 billion = approximately 2.83% of market cap traded in 24 hours. Note the 200-day change (-12.73%) is less negative than the 30-day change (-17.05%), implying a prior rally inside the 200-day window that has since been unwound.
Market Setup
The cross-asset backdrop is neutral on risk sentiment with moderately negative equity momentum, and DACH indices are outperforming global peers. Euro-area rates are mixed with a flattening curve: the AAA 10Y yield sits at 3.37% (up 8.2 bp over 5 days), the 2Y at 3.08% (up 14.5 bp), and the 10Y-2Y spread stands at 29.2 bp. The euro is weaker against the dollar, with EUR/USD at 1.1084, down 1.14% over 5 days and 5.67% YTD, which mechanically supports EUR-quoted BTC prices relative to USD terms. Rotation is visible within equities: the DAX leads on a 1-month basis at +5.74% while the Nasdaq Composite is -5.83% over the same period, and DACH indicators average +1.62% over 5 days versus +0.10% for global equity indicators.
Policy rates are restrictive for risk assets. The US Federal Funds target range is 3.75% to 4.00% as of 13 November 2026, following a 25 bp hike effective 17 September 2026. The ECB deposit facility rate is 2.50% as of 14 November 2026, following a 25 bp hike effective 16 September 2026. This matters for BTC because institutional adoption has tied the asset more closely to traditional macro and credit cycles than during the retail-driven era [T3].
Scenario assumptions: if euro-area yields continue rising near term, EUR-quoted BTC faces compounded pressure from risk aversion and discount rates. Conversely, a weaker euro supports EUR-quoted prices even if USD-quoted BTC is flat.
Investment Thesis
Bitcoin is in a deep drawdown phase, 43.41% below its October 2025 ATH, yet the structural institutional thesis remains intact. The core case rests on three pillars: fixed supply (95.77% of the 21 million cap already issued), maturing regulated infrastructure such as spot ETFs and qualified custodians, and rising allocator demand for multi-year diversification [T3]. Institutions cite scarcity, portfolio diversification, and end-client demand as the primary reasons for ownership [T3].
The market regime has matured. ETF flows have effectively become Bitcoin’s new macro indicator, and record Q4 2025 outflows coincided with breaks of key support around $98,000, according to a year-end review published in early 2026 [T2]. The crypto ETF complex briefly exceeded $200 billion in assets and received more than $40 billion of inflows in 2025 despite volatility, per Morgan Stanley [T8]. Critically, both institutional and retail holders largely stayed invested through the roughly 50% drawdown (USD basis), with UAE sovereign wealth funds and family offices reportedly buying the discount, and Strategy holding 845,256 BTC as of 8 June 2026 [T7].
Volatility has structurally declined, from 84% to 43% per the Glassnode x Fasanara 2025 report cited in [T2], though adoption has coupled BTC to macro cycles rather than eliminated volatility [T3]. The near-term path is hostage to two variables: the direction of ETF flows and the restrictive policy backdrop. The base scenario assumes consolidation in a macro-controlled range until flows turn sustainably positive and the CLARITY Act progresses into law. As an upper-bound strategist expectation, one commentator cited in [T2] sees a path toward $200,000 over the next full cycle if regulatory clarity unlocks conservative capital pools and macro conditions cooperate; this is an expectation, not a forecast of this report.
Bullish Drivers
Four catalysts could reverse the drawdown from current levels:
- ETF flow recovery. Spot BTC ETFs posted seven straight weeks of inflows as of May 2026, with Fidelity’s FBTC a steady contributor and newer Morgan Stanley Bitcoin-related funds widening participation [T4]. Dip-buying behavior was evident, with buying returning quickly after short selling bouts [T4].
- Regulatory legislation. The CLARITY Act would establish a federal market-structure framework and could unlock broader institutional participation if passed [T1]. A September 15 vote on the Act was flagged as a potential sentiment catalyst in a 2026 publication [T5], and seven circulating regulatory bills targeting market structure could lower institutional barriers [T7].
- Demonstrated rebound capacity. In August 2026, BTC rallied from the low-$60,000s to around $80,000, gaining nearly 20% in a week on macro tailwinds, short covering, regulatory optimism, and renewed ETF demand, according to a piece dated 27 August 2026 [T6].
- Supply scarcity and broadening adoption. With 20,111,659 of 21,000,000 BTC issued, marginal demand increasingly moves price. Pension funds, endowments, and foundations have begun small BTC allocations as long-term inflation hedges [T8].
Bull scenario (assumption): a sustained return to positive net ETF flows, identified by CoinDesk Indices as the key signal to watch [T1], combined with CLARITY Act passage, restarts institutional accumulation from EUR 60,921.
Relative Positioning vs Gold and Ethereum
Versus gold: gold price data is not in the dataset, so the comparison is qualitative. BTC is frequently positioned within the debasement trade alongside gold [T6], but the two assets diverge in drawdown behavior: BTC’s -43.4% decline from ATH in EUR terms underscores that it behaves as a high-beta risk asset in restrictive-rate regimes, not as a haven. In a risk-off extension, BTC can act as the relative safe haven within crypto, given its liquidity and 58.79% dominance, mirroring the pattern noted in August 2026 [T6].
Versus Ethereum: ETH ETFs recorded $690 million in net outflows in Q2 2026, following Bitcoin’s larger redemptions, per CoinDesk Indices [T1]. During the August 2026 rebound, flows into Ether, Solana, XRP, and newer products suggested broadening crypto risk appetite rather than BTC-only demand [T6]. Scenario assumption: if the CLARITY Act lifts the whole complex, ETH and altcoin ETFs could capture flow share at BTC’s margin, compressing dominance from 58.79%. Conversely, in stress phases BTC’s dominance typically rises as capital consolidates into the deepest market. Regionally, pure bitcoin ETFs play a smaller strategic role in Asia than in North America and Europe, where tokenization and stablecoin regulation dominate adoption [T1].
Scenario Framework
All scenarios are assumptions conditioned on the policy backdrop: Fed funds target range of 3.75% to 4.00% and ECB deposit rate of 2.50%, both set by 25 bp hikes effective mid-September 2026. Per CoinDesk Indices in a July 2026 publication, the Fed under Chair Kevin Warsh was expected to hold rates through Q3, leaving limited room for easing [T1]; this is a dated market expectation, not a decision, and current rate expectations are not in the dataset.
- Bull (assumption): CLARITY Act passes, ETF flows turn sustainably positive, and the Fed holds at 3.75% to 4.00% without further hikes. BTC recovers toward prior support zones; the $200,000 cycle reference from [T2] serves only as an upper-bound strategist expectation.
- Base (assumption): rates stay restrictive and flows stay choppy. BTC oscillates in an indicative EUR 55,000 to 70,000 range while regulatory progress accumulates; no easing-driven repricing.
- Bear (assumption): ETF redemptions resume at Q2 2026 magnitude ($4.67 billion in quarterly net outflows, the largest since the January 2024 launch, with June a record redemption month) [T1], the Fed delivers another hike, and BTC breaks below the EUR 60,318 24-hour low toward a deeper drawdown than the current -43.4% from ATH.
No price reference in this framework is a forecast of central bank action or a report target.
Valuation Discussion
Bitcoin has no cash flows, so valuation rests on supply, flows, and positioning. Market cap equals fully diluted valuation at EUR 1.225 trillion because circulating supply (20,111,659) equals total supply; 95.77% of the 21 million cap is issued, leaving 888,341 BTC unissued. Price is 43.41% below the October 2025 ATH, requiring a +76.7% move to reclaim it. The 24-hour turnover ratio of approximately 2.83% of market cap indicates active but not euphoric trading.
Flow-based valuation support is the swing factor. The crypto ETF complex exceeded $200 billion AUM at peak and received over $40 billion in 2025 [T8], while the FBTC-anchored complex is described at approximately $100 billion in a 2026 source [T7]. Scenario assumption: if the complex returned to 2025-style net inflows of over $40 billion annually, converted at EUR/USD 1.1084, that equals roughly EUR 36 billion, or approximately 2.9% of the current BTC market cap per year, a meaningful demand floor. Scarcity metrics are static; marginal price discovery remains flow-driven, so any valuation range must be conditioned on the Scenario Framework. Note that EUR/USD at 1.1084, down 5.67% YTD, flatters EUR-quoted valuations relative to USD terms by that currency effect. USD-quoted levels in news sources ($80,000 rebound, $98,000 support) are indicative only and not directly comparable to the EUR-quoted price here.
Risks
- Restrictive policy. The Fed at 3.75% to 4.00% and the ECB at 2.50%, both after September 2026 hikes, leave limited easing support; the expectation of a Fed hold through Q3 is dated July 2026 and may not reflect current pricing [T1].
- Flow reversal. Q2 2026’s record $4.67 billion quarterly ETF redemptions demonstrated how quickly institutional capital rotates into traditional markets [T1]. Q4 2026 flow data is not in the dataset, so the current flow direction is unavailable.
- Regulatory failure. Negative regulatory developments could significantly affect institutional allocation, and CLARITY Act passage is not assured [T3, T5].
- Custody and operational risk. Hacks and internal exploits could put funds at risk even with qualified custodians [T3].
- Concentration risk. ETF assets sit with a handful of issuers, raising market-structure questions if any issuer experiences operational stress [T3].
- Macro coupling. Institutional adoption has tied BTC more tightly to macro and credit cycles, and treasury-leveraged equity strategies have shown amplified drawdowns relative to the token [T3].
- Momentum. Performance is negative across all measured horizons, with a 30-day decline of 17.05% and a 1-year decline of 32.36%.
Scenario assumptions: a further Fed hike beyond the 3.75% to 4.00% range would extend the restrictive backdrop and likely deepen redemptions; failure or delay of the CLARITY Act would remove the primary regulatory catalyst and prolong the drawdown.
Appendix
Methodology and data provenance. Market data retrieved 2026-11-14T05:15:09Z via CoinGecko for bitcoin in EUR quote currency. Equity data as of 2026-11-13; ECB yield curve data as of 2026-11-12; FX data as of 2026-11-14. Policy rates come from the authoritative policy rates block: US Federal Funds target range 3.75% to 4.00% (as of 2026-11-13, FRED source) and ECB deposit facility rate 2.50% (as of 2026-11-14, ECB source). Benchmark assets gold and ethereum are named in the asset configuration; gold price data is not included in the dataset, and no current Ethereum price is included, so the benchmark comparison is qualitative and flow-based.
Source dating. Most news items lack publication dates in metadata; where dates are inferable they are stated inline: T4 is dated 13 May 2026, T6 is dated 27 August 2026, T1 carries a July 2026 URL date, and T7 references holdings data as of 8 June 2026. No figure from a news source is presented as current market state. All scenario price references are labeled as assumptions or strategist expectations. The USD-basis drawdown of roughly 50% described in [T7] differs from the EUR-basis drawdown of 43.41% in this report; the discrepancy reflects currency effects and is noted rather than reconciled.
Sources
- [T1] Q2 2026 Digital Asset Review, CoinDesk Indices: link
- [T2] Crypto Market 2025: Year-End Review & Expert Insights, TradingView News: link
- [T3] Institutional Bitcoin Adoption Explained: How Blackrock, Fidelity and Others Embraced BTC, The Block: link
- [T4] Bitcoin (BTC) ETFs See 7 Weeks of Inflows: Is the Institutional Bid Back?, 24/7 Wall St.: link
- [T5] Crypto ETFs Enter a New Phase in September: Here’s What Investors Should Watch, Bitcoin Foundation: link
- [T6] Bitcoin Leads Broader Rebound, ETFdb: link
- [T7] Both Institutions and Retail Are Buying and Holding Crypto Despite Bitcoin’s 50% Pullback, Yahoo Finance: link
- [T8] Digital Assets Go Mainstream as Global Adoption Accelerates, Morgan Stanley: link
Disclaimer. This report is AI-generated and provided for informational purposes only. It does not constitute investment advice, a recommendation, or an offer to buy or sell any financial instrument. Figures should be verified independently before any investment decision.
Important Note / Wichtiger Hinweis:
EN: This report may have been generated using AI. It processes data from publicly available sources. The content is provided for informational purposes only.DE: Dieser Bericht kann mithilfe von KI erstellt worden sein. Dabei werden Daten aus öffentlich zugänglichen Quellen verarbeitet. Die Inhalte dienen ausschließlich Informationszwecken.
* DE: Die ergänzenden Inhalte können KI-generiert sein. EN: The additional content may be AI-generated.