
Listen to the summary
Key Data Snapshot
| Metric | Value | Trend |
|---|---|---|
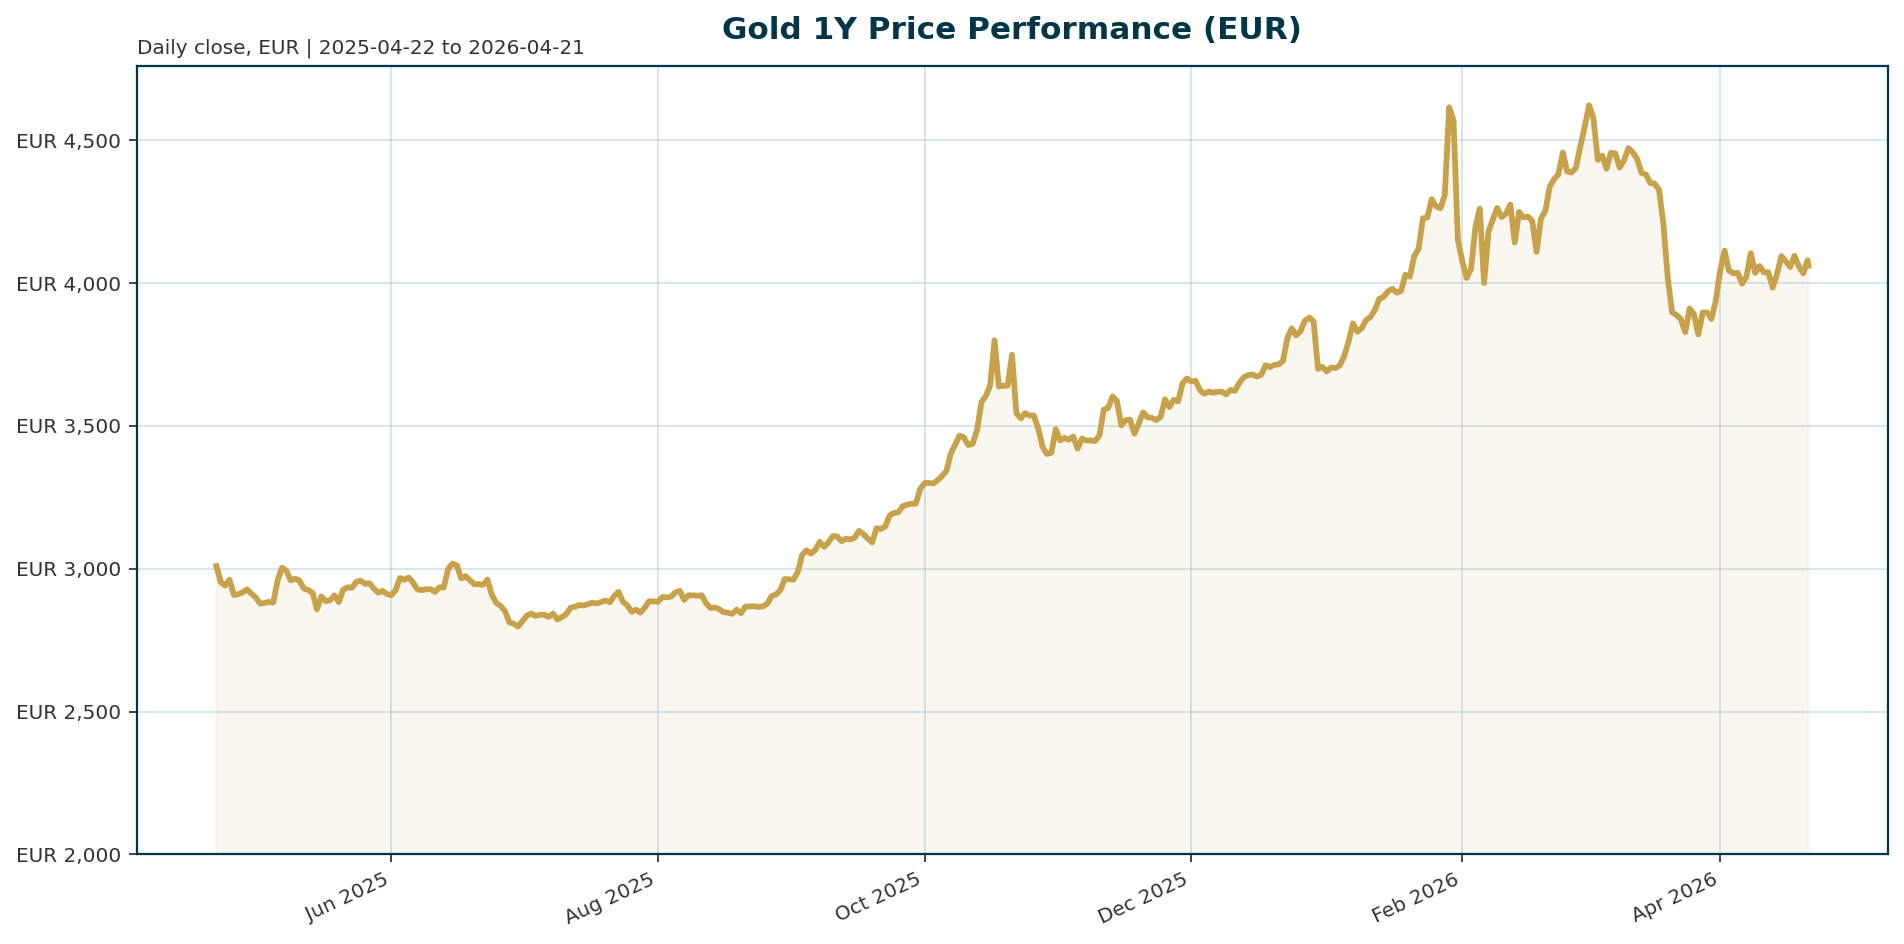
| Price (XAU/EUR) | 4,060.27 | -0.05% |
| 24h High | 4,086.11 | – |
| 24h Low | 4,056.13 | – |
| 1-Year Change | +37.43% | Strong Bullish |
| All-Time High (ATH) | 4,688.32 (Jan 2026) | -13.37% |
| Market Cap Rank | 40 | – |
| BTC Dominance | 57.58% | – |
| 24h Volume | 163.13M EUR | -0.71% |
Macro Backdrop
Risk sentiment is broadly positive with the Nasdaq Composite leading equity gains at 3.24% over five days, while the DAX lags at 1.55% [market_overview]. The rates backdrop shows Euro area yields falling, with the AAA 10Y yield at 3.03% and down 9.8 basis points over the past five days, contributing to a steepening curve [market_overview]. FX dynamics are mixed, with EUR/USD steady at 1.1777 and EUR/GBP showing strength [market_overview]. Key observations highlight the divergence between strong US tech performance and weaker European indices, alongside the Euro area yield curve steepening [market_overview].Investment Thesis
Gold is currently acting as a high-beta asset reacting to risk sentiment and USD dynamics rather than traditional safe-haven flows [T5][T6]. This behavior suggests the market is prioritizing near-term liquidity and risk appetite over its historical store-of-value role. However, the long-term thesis remains anchored on real interest rates falling below 1% or turning negative, which historically triggers accumulation phases [T2]. Strategists anticipate a powerful surge toward 9000 EUR post-recession [T7]. While current volatility is driven by geopolitical de-escalation and central bank sales, the fundamental driver for a sustained move remains real yield compression and currency debasement concerns.Bullish Drivers
- Real Yield Compression: The primary catalyst for a sustained bull run is the Euro area 10Y yield falling below 1% or turning negative, reducing the opportunity cost of holding non-yielding bullion [T2].
- Geopolitical Resurgence: A breakdown in US-Iran diplomatic talks or renewed trade tensions could trigger safe-haven flows, supporting prices above 4,200 EUR [T4][T7].
- Currency Debasement: Rapid government deficit expansion and rising debt-to-GDP ratios increase inflation expectations, supporting portfolio hedge demand [T2].
- Central Bank Support (Structural): Despite recent sales, central banks remain a dominant pillar; major consumers like China historically step in during price dips to build reserves [T1].
Relative Positioning vs Bitcoin and Ethereum
Gold remains the benchmark asset (XAU) and ranks #40 by market cap, significantly below Bitcoin and Ethereum which dominate the crypto sector [market_data]. With BTC dominance at 57.58%, the correlation between gold and crypto is currently driven by risk sentiment rather than fundamental divergence [market_data]. In a risk-on environment, crypto often outperforms gold, while in a risk-off or recessionary environment, gold’s store-of-value narrative typically strengthens relative to volatile digital assets.Scenario Framework
- Scenario 1 (Bullish/Recession): Stagflation leads to real yields turning negative. Gold surges toward 9,000 EUR as investors flee to hard assets [T7].
- Scenario 2 (Bearish/De-escalation): US-Iran peace talks succeed, inflation fears ease, and the USD strengthens. Gold corrects to 3,500-3,800 EUR as high-beta flows reverse [T4][T5].
- Scenario 3 (Neutral/Structural Shift): Persistent selling by EM central banks (Russia, Ghana, Poland) to fund defense and currency deficits outweighs retail demand. Gold acts as a high-beta asset trading in a range [T1][T6].
Valuation Discussion
Gold is currently trading at 4,060.27 EUR, representing a 13.37% discount from its January 2026 ATH of 4,688.32 EUR [market_data]. While this presents a valuation entry point, the current macro backdrop suggests the asset is not yet in a deep accumulation phase as real yields remain positive. The critical threshold for a valuation reset remains the Euro area 10Y yield falling below 1% [T2]. Until real yields turn negative, the premium over recent highs may persist.Risks
- Central Bank Sell-Off: Structural shifts in demand are underway, with Russia, Ghana, and Poland selling reserves to finance budget shortfalls and defense spending [T1].
- Real Yield Stickiness: If inflation expectations remain sticky, real yields could stay above the 1% threshold, capping upside potential [T6].
- Geopolitical Resolution: A successful diplomatic resolution to US-Iran tensions could remove a key source of inflationary pressure and risk premium [T4].
- USD Strength: A sustained USD appreciation, driven by US economic outperformance, would put downward pressure on gold priced in EUR [T5].
Appendix
Sources
- Central banks were buying gold at record levels. Here’s why they’re selling now – CNBC [T1]
- Understanding Gold Sector Cycles: Multi-Year Strategic Investment Framework – Discovery Alert [T2]
- Gold price holds gain as renewed push for US-Iran talks eases risks – Bitget [T3]
- Gold price holds gain as renewed push for US-Iran talks eases risks – Mining.com [T4]
- Gold losing safe-haven status? Why it’s acting like high-beta asset – Invezz [T5]
- Gold losing safe-haven status? Why it’s acting like high-beta asset – Shanghai Metals Market [T6]
- Gold’s next surge comes after recession, says macro strategist – Mining.com [T7]
This report is AI-generated for informational purposes only and does not constitute investment advice. The analysis is based on data available as of April 21, 2026.
Important Note / Wichtiger Hinweis:
EN: This report may have been generated using AI. It processes data from publicly available sources. The content is provided for informational purposes only.DE: Dieser Bericht kann mithilfe von KI erstellt worden sein. Dabei werden Daten aus öffentlich zugänglichen Quellen verarbeitet. Die Inhalte dienen ausschließlich Informationszwecken.
* DE: Die ergänzenden Inhalte können KI-generiert sein. EN: The additional content may be AI-generated.