
Listen to the summary
Key Data Snapshot
| Metric | Value |
|---|---|
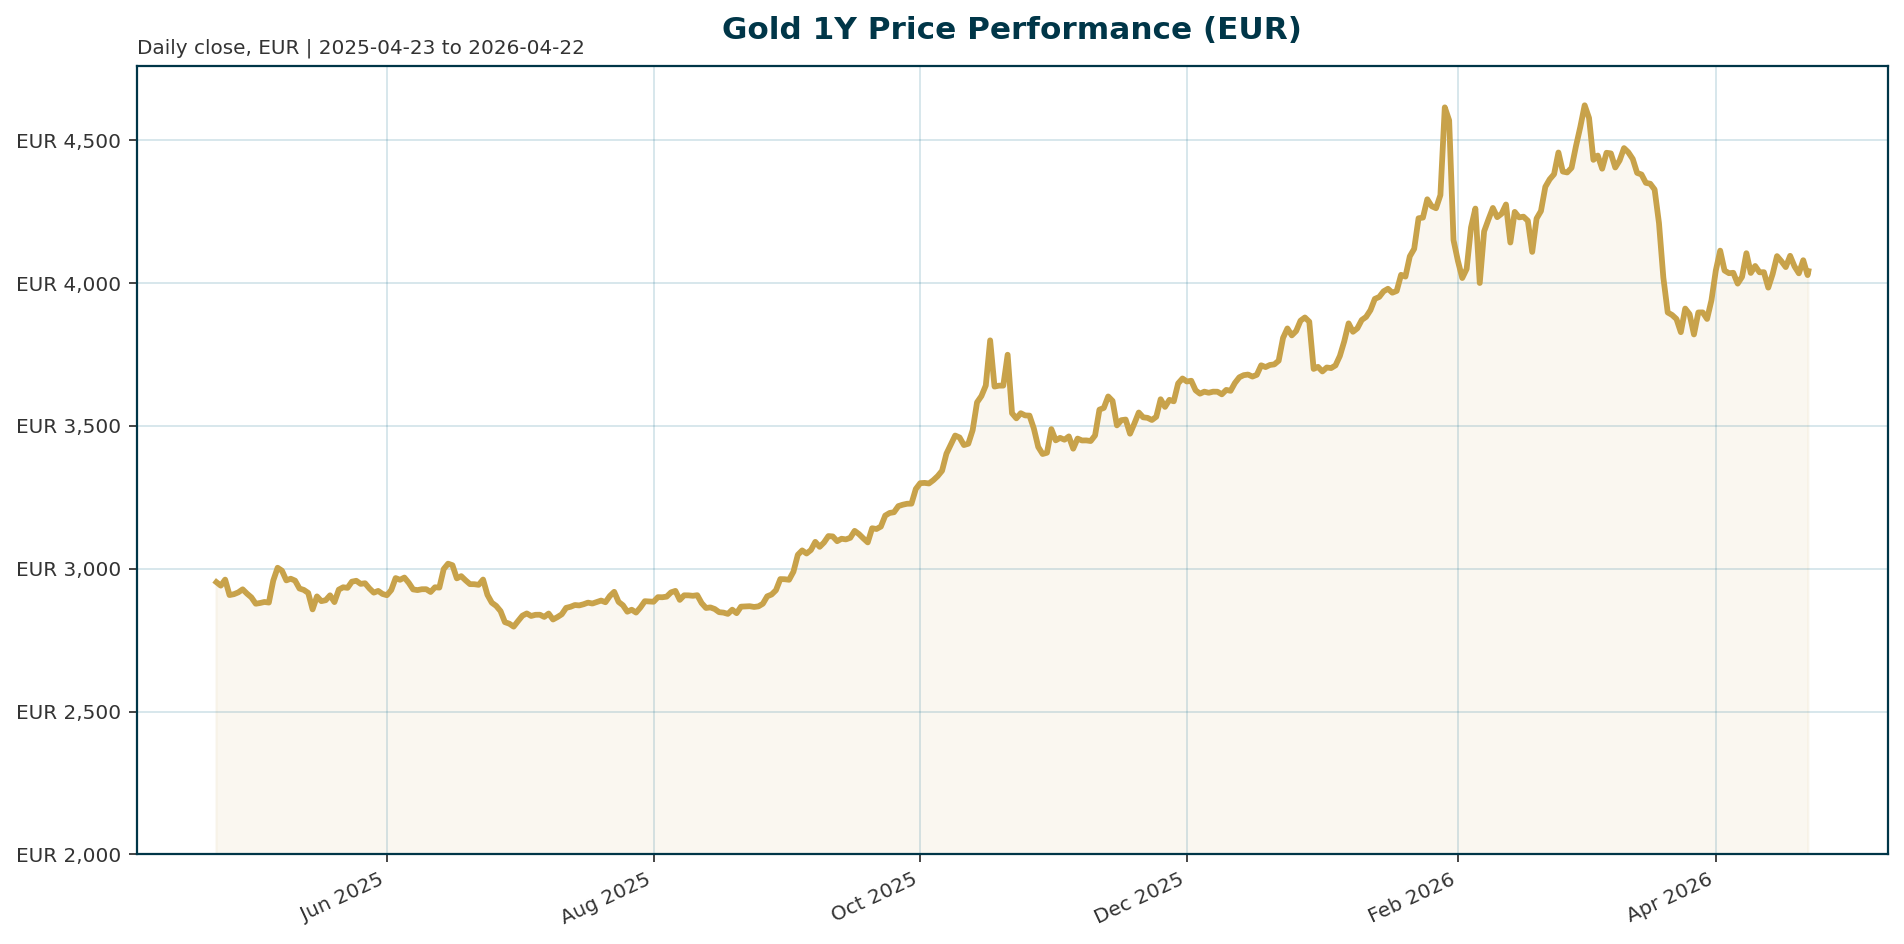
| XAU/EUR Price | 4,042.88 |
| 1-Year Return | +33.46% |
| 30-Day Return | +6.70% |
| 200-Day Return | +21.93% |
| All-Time High (ATH) | 4,688.32 EUR (Jan 2026) |
| ATH Distance | -13.74% |
| Euro Area 10Y Yield | 3.04% |
| Euro Area 2Y Yield | 2.42% |
| EUR/USD | 1.1764 |
Current price is 13.7% below the January 2026 ATH, indicating room for recovery if demand remains strong.
Macro Backdrop
Risk sentiment remains broadly positive with the Nasdaq Composite and Nikkei 225 leading global equity gains. However, the Euro yield curve is steepening, with the 10-year yield at 3.04% and the 2-year yield at 2.42%, creating a mixed backdrop. The Fed is expected to hold rates steady [T1], while the ECB enters the current inflation shock in a strong position [T8]. The positive equity momentum and rising yields present headwinds for non-yielding bullion, requiring real yield declines to sustain rallies.
Investment Thesis
Gold serves as a critical ballast in a stressed 60/40 portfolio, particularly in stagflationary regimes where stock-bond correlations are unreliable [T5]. Structural demand is being supported by central banks diversifying away from USD-denominated reserves, with Uganda’s domestic gold purchase program serving as a regional example [T7]. The primary macro driver remains real interest rates, which act as the primary determinant of gold sector cycle direction. When real yields fall below 1% or turn negative, precious metals typically enter accumulation phases [T2].
Bullish Drivers
- Geopolitical Risk Premiums: Ongoing conflicts and trade tensions support defensive asset demand independent of monetary policy considerations [T2]. The US-Iran situation, while easing inflation fears, still maintains a floor for prices due to lingering tensions [T1].
- Long-Term Forecasts: UBS maintains a firm long-term forecast of 6,200 EUR per ounce by 2026, suggesting significant upside potential if real yields normalize [T4].
- Liquidity Dynamics: A potential smaller Fed balance sheet could eventually free up liquidity, supporting gold prices [T6].
- Performance Resilience: Gold significantly outperformed Bitcoin in 2025 (+65% vs -5%), demonstrating its effectiveness as a time-tested bunker during inflationary periods [T3].
Relative Positioning vs Bitcoin and Ethereum
Gold has decoupled from risk-on assets in 2025, outperforming Bitcoin significantly despite high inflation, highlighting its defensive utility [T3]. Bitcoin currently trades as a liquidity-sensitive risk asset, making it vulnerable to Fed rate hikes which drain liquidity from speculative markets [T3]. Conversely, gold benefits from the same liquidity constraints as it is a non-yielding asset that often sees inflows during periods of financial stress.
Scenario Framework
Based on the multi-year strategic framework [T2], the following scenarios are key:
- Soft Landing (35% Probability): The Fed successfully manages inflation without triggering a recession. Gold target range: 2,200-2,400 EUR. Timeline: 12-18 months.
- Recession (40% Probability): Economic weakness triggers an aggressive monetary policy response. Gold target range: 2,500-3,000 EUR. Timeline: 6-12 months.
- Stagflation (25% Probability): Persistent inflation combined with economic weakness. Gold target range: 3,000+ EUR. Timeline: 18-24 months.
Valuation Discussion
Current price is 13.7% below the January 2026 ATH of 4,688.32 EUR, suggesting valuation is not stretched relative to the peak of the last cycle. Long-term forecasts from institutions like UBS target 6,200 EUR by 2026, implying significant upside potential if real yields normalize [T4].
Risks
- Real Yield Headwinds: A sustained rise in real yields above 1% would act as a significant headwind, forcing gold to transition back to a high-beta asset [T2].
- Safe Haven Status: Gold’s traditional role as a portfolio shelter is coming under scrutiny, with Morgan Stanley questioning its safe-haven role [T4].
- Geopolitical Resolution: If US-Iran diplomacy succeeds completely, the geopolitical risk premium could evaporate, potentially triggering a correction [T1].
Appendix
Sources
- Gold price rises as push for US-Iran diplomacy eases inflation risk – Mining.com [T1]
- Understanding Gold Sector Cycles: Multi-Year Strategic Investment Framework – Discovery Alert [T2]
- Beyond the memes: Understanding the unique roles of gold and Bitcoin – New York Post [T3]
- Gold losing safe-haven status? Why it’s acting like high-beta asset – Shanghai Metals Market [T4]
- The 60/40 Portfolio Is Under Stress Again And This Time Is Different – Forbes [T5]
- As Warsh faces hearing, a framework for smaller Fed balance sheet emerges – Reuters [T6]
- Uganda’s central bank starts domestic gold purchase program – Mining.com [T7]
- ECB is good starting position to deal with inflation shock, Schnabel says – KITCO [T8]
This report is AI-generated, for informational purposes only, and not investment advice.
Important Note / Wichtiger Hinweis:
EN: This report may have been generated using AI. It processes data from publicly available sources. The content is provided for informational purposes only.DE: Dieser Bericht kann mithilfe von KI erstellt worden sein. Dabei werden Daten aus öffentlich zugänglichen Quellen verarbeitet. Die Inhalte dienen ausschließlich Informationszwecken.
* DE: Die ergänzenden Inhalte können KI-generiert sein. EN: The additional content may be AI-generated.