
Listen to the summary
Key Data Snapshot
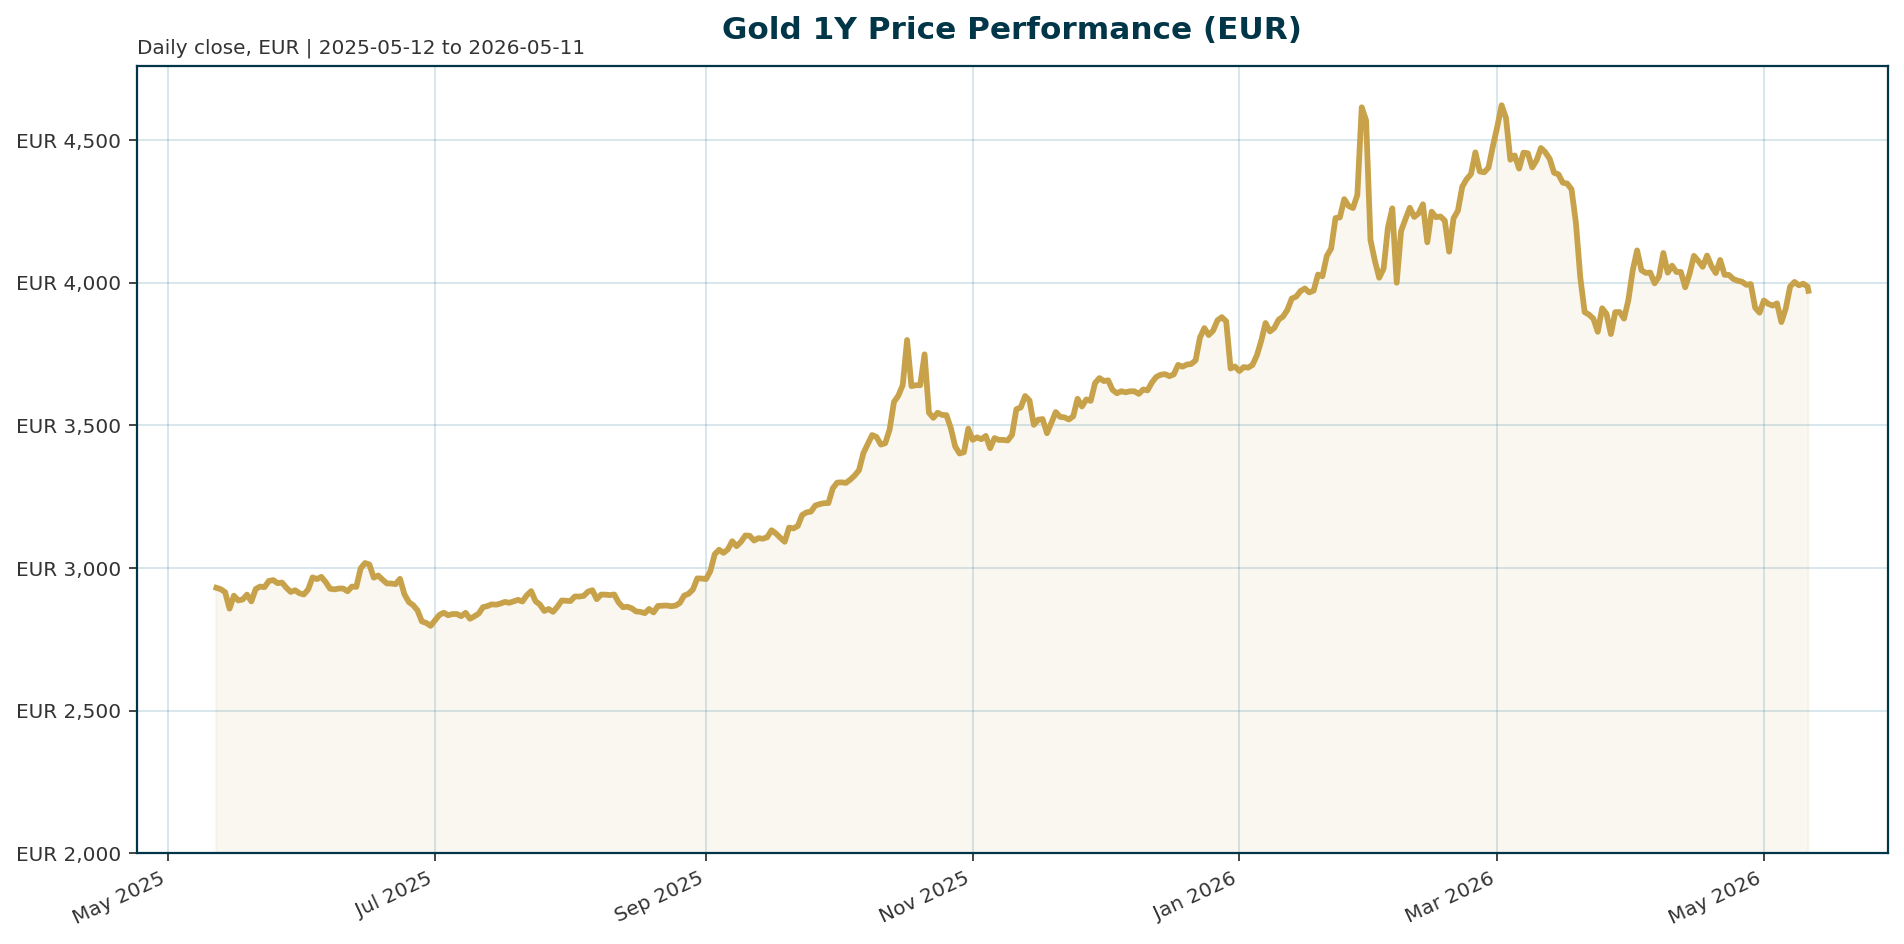
Gold is currently trading at 3,973.05 EUR, down 0.67% over the last 24 hours but up 34.36% year-to-date. The asset remains 15.2% below its January 2026 all-time high of 4,688.32 EUR. Bitcoin dominance stands at 58.21%, indicating a strong risk-on appetite in the broader crypto market.
| Metric | Value | Change (24h) |
|---|---|---|
| Price (XAU/EUR) | 3,973.05 | -0.67% |
| 24h High | 4,008.06 | – |
| 24h Low | 3,971.29 | – |
| 1-Year Change | +34.36% | – |
| ATH (All Time High) | 4,688.32 | -15.22% |
| BTC Dominance | 58.21% | – |
Macro Backdrop
Risk sentiment is broadly positive, driven by strong performance in Asian equities, most notably the Nikkei 225 which posted a 5.63% gain over five days. However, the DAX is lagging, up only 1.45% over the same period, suggesting a divergence between European and global risk appetite. The Euro area 10-year yield sits at 3.04%, having fallen 5.7 basis points over five days, which supports the non-yielding nature of gold. The FX backdrop is mixed, with EUR/USD at 1.1743, offering a slight tailwind for EUR-denominated gold, though global dollar funding pressures complicate the narrative.
Investment Thesis
Gold is navigating a dichotomy between its traditional safe-haven role and its emerging function as a liquidity source. While geopolitical tensions, specifically regarding Iran, maintain safe-haven demand, high interest rates and dollar funding needs are exerting significant downward pressure. Central banks remain the primary structural buyers, driving a shift away from the US dollar toward alternative reserves. The current price action reflects a tug-of-war between these forces, with the metal acting as a buffer against inflation while simultaneously being mobilized for dollar liquidity by stressed economies.
Bullish Drivers
- Central Bank Accumulation: Central banks continue to aggressively accumulate gold, driven by the BRICS+ trend and a desire to diversify reserves away from the US dollar [T2][T3].
- Producer Cash Flow: Major miners like Newmont and Kinross are generating record free cash flows, supporting sector stability and potential M&A activity [T5].
- Long-Term Forecasts: Analysts maintain bullish price targets, with banks forecasting $5,300 to $6,000 per ounce over the next 9 to 12 months [T5].
- Bond Market Dynamics: Fixed income strategists warn that markets are overlooking global growth slowdowns and high energy prices, which could eventually force a pivot in monetary policy [T7].
Relative Positioning vs Bitcoin and Ethereum
Bitcoin dominance is currently elevated at 58.21%, suggesting that crypto assets are capturing the bulk of risk-on capital flows. While Bitcoin trades at $80,367.02 and Ethereum at $2,316.99 [T5], Gold remains the primary reserve asset and the ultimate hedge against systemic dollar weakness. The current rotation implies that while crypto leads risk-on rallies, Gold serves as the stabilizing anchor during periods of fiscal or geopolitical stress.
Scenario Framework
- Bullish Scenario: A de-escalation of the Iran conflict combined with a dovish pivot from the Federal Reserve would trigger a retest of the ATH. Euro area yields continue to fall, supporting a price target above 4,500 EUR.
- Base Case: The market remains range-bound between 3,800 and 4,200 EUR. Inflation remains sticky, keeping the Fed on hold, while central bank buying provides a floor for prices.
- Bearish Scenario: Sustained dollar strength and renewed fiscal concerns trigger a liquidity crunch. Gold is sold by stressed sovereigns (similar to the Turkey example) to meet dollar-denominated obligations. Prices could break below 3,500 EUR.
Valuation Discussion
Gold is currently trading at a 15.2% discount to its January 2026 all-time high. Relative to analyst long-term forecasts of $6,000/oz ($7,000+ EUR), the current price offers an attractive entry point. The discount is justified by the current liquidity squeeze and high real yields, but the structural demand from central banks suggests the valuation gap is narrowing as the dollar reserve system continues to erode.
Risks
- Fed Policy Tightening: The Federal Reserve remains the biggest obstacle for gold, with hawkish commentary or unexpected rate hikes exerting immediate downward pressure [T1].
- Dollar Funding Crisis: Gold is serving as a funding source for stressed nations. If Persian Gulf states or Turkey face deeper dollar shortages, they may be forced to sell gold reserves to stabilize their currencies [T4].
- Energy Shock: Rising oil prices are driving demand destruction and inflation fears, potentially leading to tighter monetary policy which is detrimental to gold prices [T7].
Appendix
- Sources:
- Gold eyes $4,750/oz breakout; Fed rate path, Iran tensions in focus – Invezz [T1]
- Central banks are still hungry for gold – KITCO [T2]
- Global gold demand drives Canada’s trade into surplus, helps mitigate economic uncertainty – KITCO [T3]
- Why Safe Haven Gold Is Falling Despite The War In Iran – Yahoo News Malaysia [T4]
- Gold stock weakness may create M&A openings as producer cash flow rises – Bitget [T5]
- 3 ways the pros are trading markets right now — including a mistake one says bond traders are making – CNBC [T6]
- Markets are overlooking a growth slowdown, which is a looming concern: Azimut – CNBC [T7]
- Investors should take advantage of global rate differentials: AllianceBernstein – CNBC [T8]
Disclaimer: This report is AI-generated for informational purposes only and does not constitute investment advice. The views expressed herein are those of the author and do not reflect the official policy or position of any agency, employer, or company.
Important Note / Wichtiger Hinweis:
EN: This report may have been generated using AI. It processes data from publicly available sources. The content is provided for informational purposes only.DE: Dieser Bericht kann mithilfe von KI erstellt worden sein. Dabei werden Daten aus öffentlich zugänglichen Quellen verarbeitet. Die Inhalte dienen ausschließlich Informationszwecken.
* DE: Die ergänzenden Inhalte können KI-generiert sein. EN: The additional content may be AI-generated.