
Listen to the summary
Key Data Snapshot
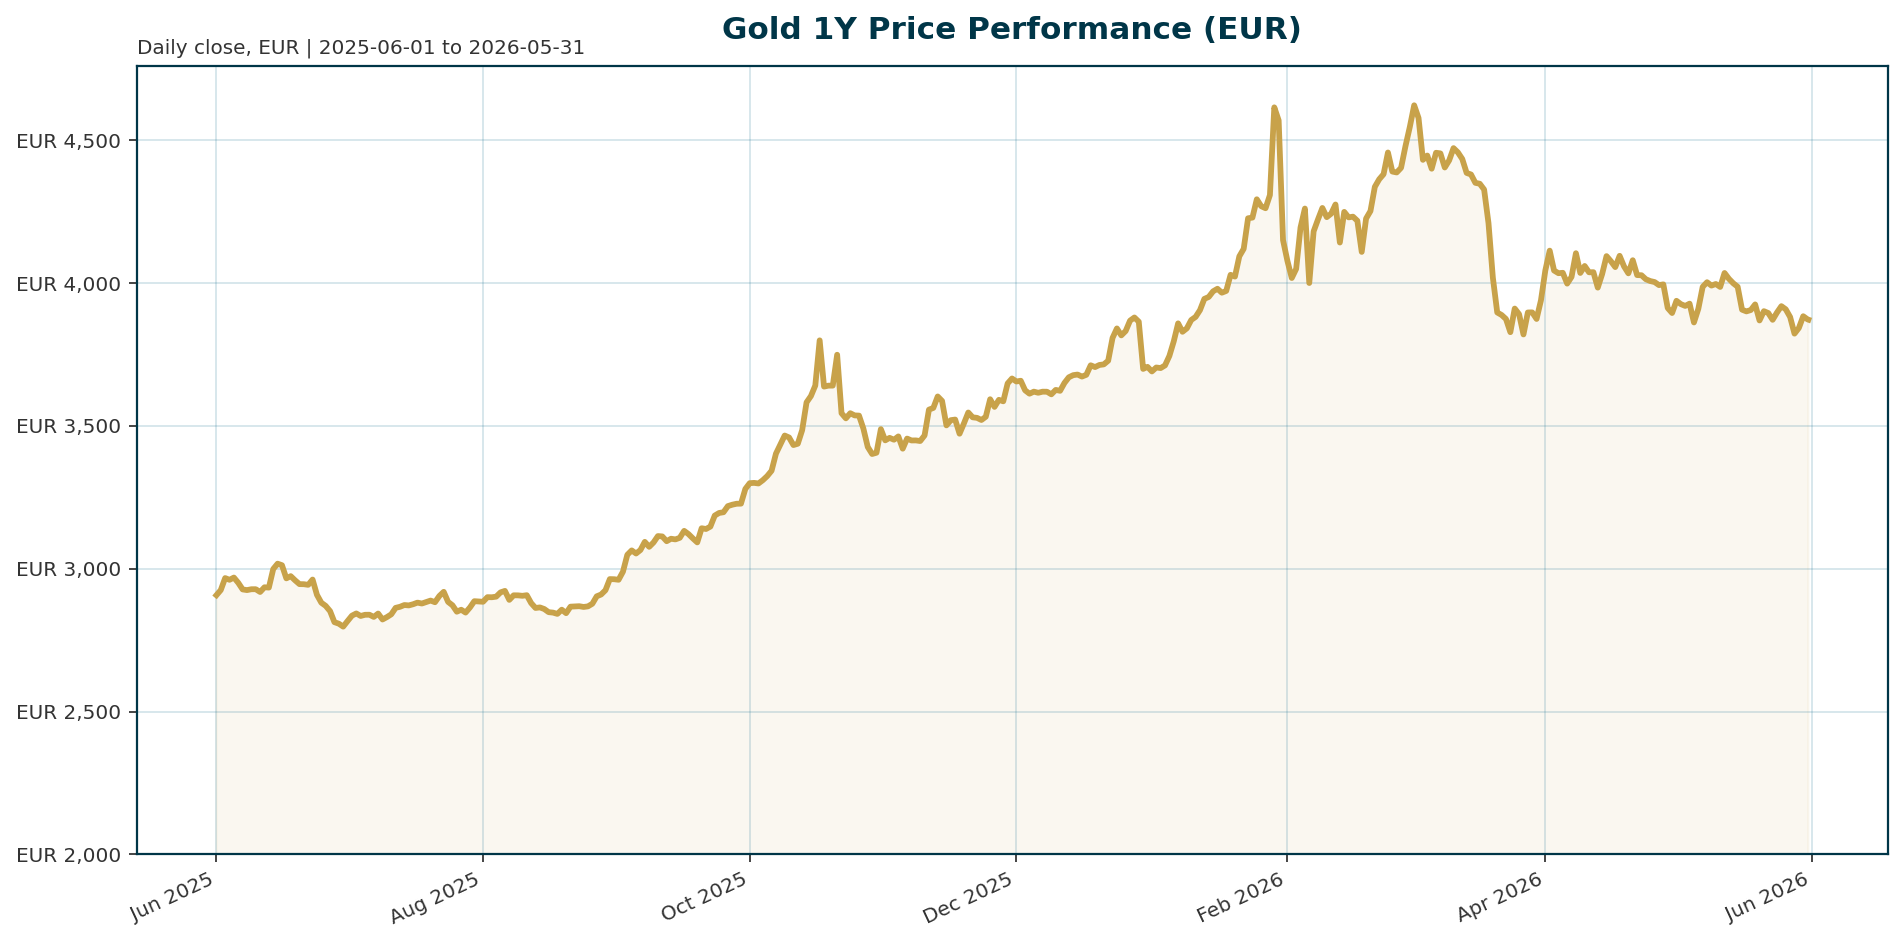
| Metric | Value | Change |
|---|---|---|
| Price (EUR) | 3,871.97 | -0.14% (24h) |
| All-Time High (ATH) | 4,688.32 | -17.41% (vs Jan 2026) |
| Year-to-Date (YTD) | — | +32.85% |
| 200-Day Return | — | +9.04% |
Calculation: ATH Drawdown = (3,871.97 – 4,688.32) / 4,688.32 = -17.41%
Macro Backdrop
Global equity risk sentiment is positive, with the Nasdaq Composite leading gains at 2.39% over 5 days, while the DACH region lags at -0.55%. The Euro area yield curve is mixed, with the 10-year yield at 3.03% declining 4.8 basis points over the week, suggesting a benign backdrop for real yields. The EUR/USD pair is stable at 1.1655, providing a neutral FX backdrop for EUR-denominated gold.
Investment Thesis
The structural case for gold remains robust despite short-term volatility. The weaponization of the dollar and de-dollarization trends provide a multi-year bullish anchor [T1]. Furthermore, elevated global debt burdens and persistent fiscal deficits in the US continue to elevate the strategic value of hard assets [T5]. The fundamental drivers behind gold’s rally remain intact, particularly as central banks continue to accumulate bullion [T1].
Bullish Drivers
Central bank accumulation is accelerating. Goldman Sachs forecasts purchases of 60 tons/month in 2026, while Ghana mandates miners to sell 30% of output to the state [T3][T4]. China’s central bank has extended its buying streak, and Chinese ETFs saw net inflows of RMB 3.5 billion in April [T2]. Net gold ETF inflows turned positive for the first time since early April, indicating a shift in retail and institutional positioning [T4].
Relative Positioning vs Bitcoin and Ethereum
Gold acts as the traditional safe haven, contrasting with the risk-on performance of Bitcoin (57.27% dominance) and equities [T4]. However, silver has shown relative strength, potentially outperforming gold if the macro regime shifts toward stagflation [T4]. While BTC dominance remains high, gold maintains its role as the primary hedge against geopolitical and systemic risks.
Scenario Framework
- Bullish: A peace deal in the Middle East and a Fed pivot to cuts would likely reignite rate-cut expectations, supporting gold [T7].
- Bearish: Renewed US-Iran tensions and a Fed rate hike before year-end (41% probability) would create immediate headwinds [T5].
- Base: Stagflation persists, keeping real rates low and central bank buying active, leading to a consolidation phase.
Valuation Discussion
Current levels sit 17.41% below the January 2026 ATH of 4,688.32 EUR. The recent correction aligns with a re-pricing of Fed rate hike risks. Given the +32.85% YTD performance, the current drawdown represents a consolidation phase rather than a trend reversal. The metal is offering a potential entry point for long-term holders as structural demand remains intact.
Risks
Immediate downside risks include a potential Fed rate hike due to renewed Middle East tensions [T5] and a significant demand shock from India’s new 15% gold import tax [T3]. Additionally, the erosion of central bank independence could undermine policy credibility [T6].
Appendix
Sources:
- [T1] Gold is just taking a breath and the race is not over – KITCO
- [T2] China’s Gold Holdings Rise Again as Central Bank Extends Buying Streak – The Jerusalem Post
- [T3] Gold prices face double pressure from inflation, interest rates and new moves by India – Laodong.vn
- [T4] Gold SWOT: Net gold ETF inflows turned positive – KITCO
- [T5] Gold falls as renewed US-Iran tensions dampen peace hopes – KITCO
- [T6] Inflation fight again putting central bank independence under strain – Reuters
- [T7] Gold Gains as Prospects of Iran Deal Temper Inflation Concerns – Bloomberg
- [T8] Rule changes may only yield modest Fed balance sheet contraction – KITCO
Disclaimer: This report is AI-generated for informational purposes only and does not constitute investment advice. The analysis is based on data available as of the date of publication and may become outdated or inaccurate over time.
Important Note / Wichtiger Hinweis:
EN: This report may have been generated using AI. It processes data from publicly available sources. The content is provided for informational purposes only.DE: Dieser Bericht kann mithilfe von KI erstellt worden sein. Dabei werden Daten aus öffentlich zugänglichen Quellen verarbeitet. Die Inhalte dienen ausschließlich Informationszwecken.
* DE: Die ergänzenden Inhalte können KI-generiert sein. EN: The additional content may be AI-generated.