
Listen to the summary
Key Data Snapshot
| Indicator | Value |
|---|---|
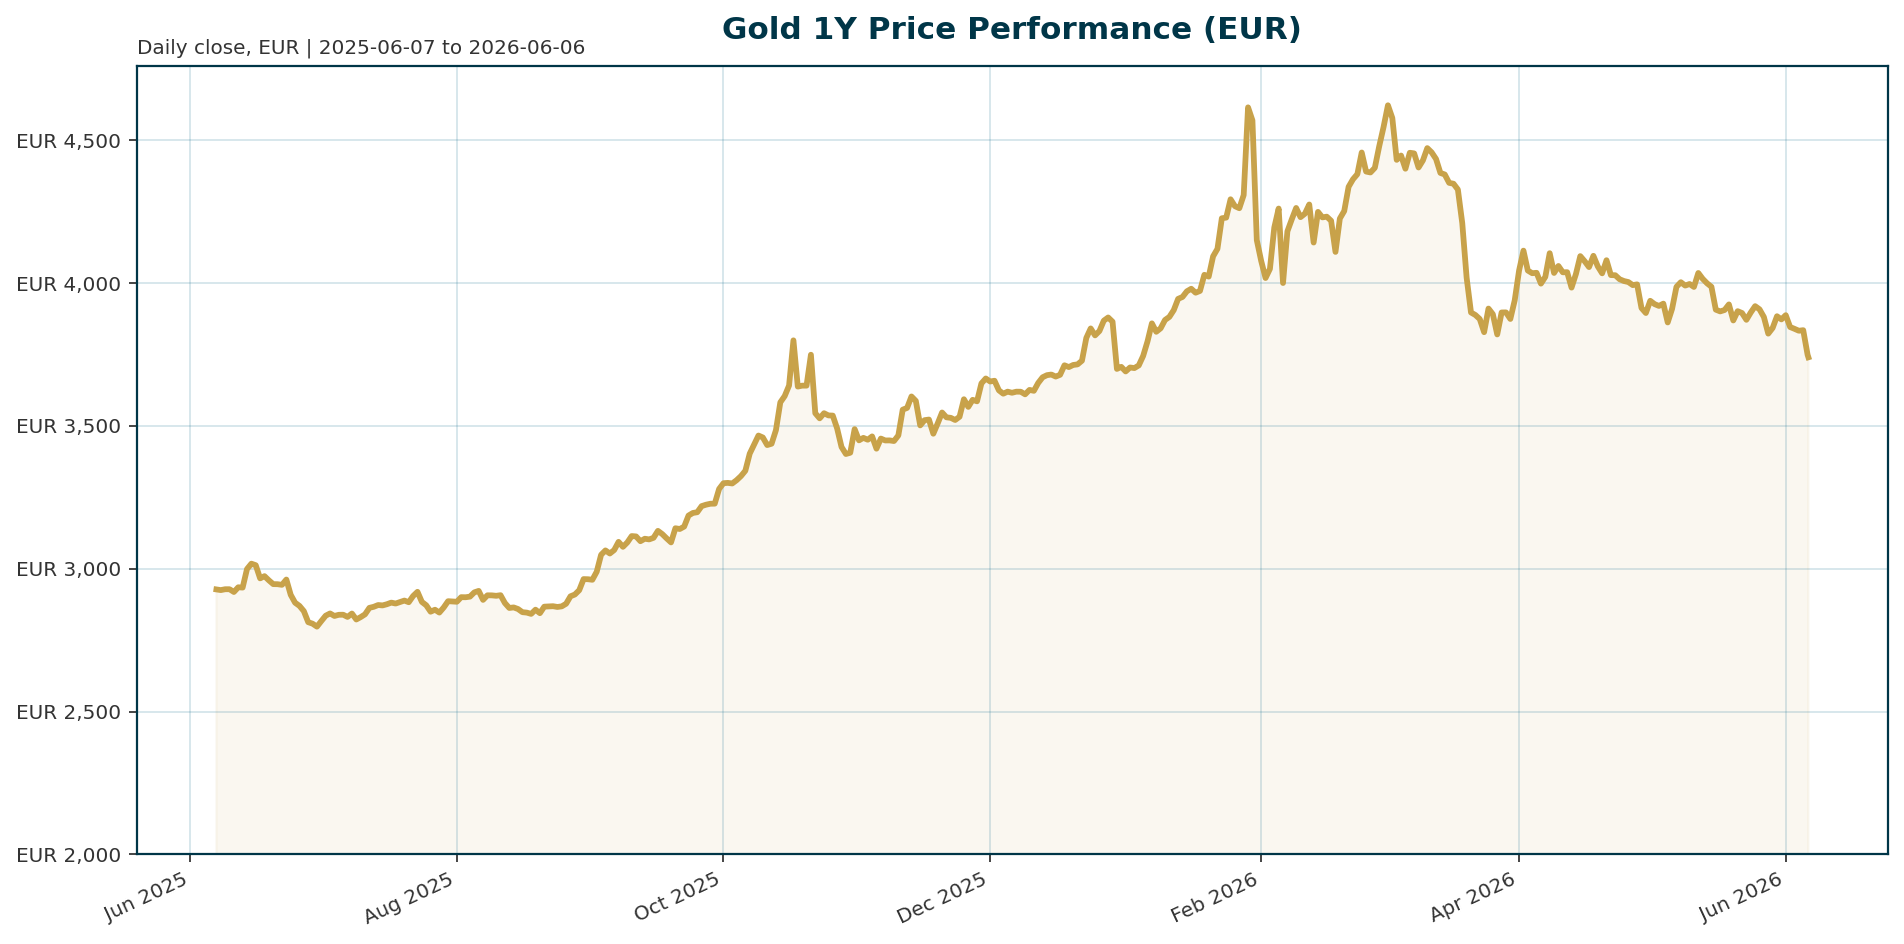
| Price (EUR) | 3,740.04 |
| All-Time High (ATH) | 4,688.32 (Jan 29, 2026) |
| Drawdown from ATH | -20.21% |
| Year-to-Date Change | +26.29% |
| 200-Day MA Status | Broken (Bearish Signal) |
| Global Reserves Share | 27% (ECB, 2025) |
Macro Backdrop
Market sentiment is neutral. Euro area yields are mixed with the 10Y at 3.07% and the 2Y-10Y spread widening to 48.8bp. FX markets are showing weakness in EUR/USD at 1.1623. Key observations include the Euro Stoxx 50 outperforming global peers while the Nasdaq Composite weakens on a 5-day basis. Persistent inflation concerns driven by the Iran war are pressuring energy prices and keeping real yields elevated.
Investment Thesis
The long-term macro thesis for gold remains structurally bullish. The Federal Reserve is trapped between rising inflation and escalating sovereign debt risks, creating a policy environment where “all roads lead to gold” [T2]. However, the short-term narrative has shifted due to geopolitical risk. Gold is currently behaving as a high-beta asset, falling during risk-off events and rallying on peace prospects, rather than acting as a traditional safe haven [T5]. This dichotomy suggests the market is pricing in a complex mix of de-dollarization trends and immediate inflationary pressures.
Bullish Drivers
- Central Bank Diversification: The ECB reported a historic milestone where gold now accounts for 27% of global foreign reserves, surpassing U.S. Treasuries at 22% [T1][T3].
- Reserve Accumulation: The World Gold Council expects central banks to buy around 850 tonnes of gold this year. Poland leads with 45 tonnes year-to-date, and China added 8 tonnes in April [T1][T4].
- De-dollarization Pressure: J.P. Morgan strategists highlight a theoretical upside to $6,000 per ounce if just 0.5% of foreign U.S. asset holdings were reallocated into gold [T3].
- Policy Trap: Sprott’s Ryan McIntyre argues the Fed has few viable options left, making gold the beneficiary of structural geopolitical shifts and supply chain fragmentation [T2].
Relative Positioning vs Bitcoin and Ethereum
Gold currently exhibits behavior similar to high-beta risk assets rather than a traditional safe haven. Since the onset of the Iran war, gold has fallen during spikes in risk aversion and rallied on prospects of cease-fires, mirroring the volatility profile of cryptocurrencies [T5]. Unlike a pure store of value, gold is reacting to immediate geopolitical news flow, suggesting it is competing with digital assets for allocation in risk-on and risk-off scenarios.
Scenario Framework
- Bullish Scenario: A peace deal in the Middle East and a dovish pivot from the Federal Reserve would trigger a re-rating. J.P. Morgan’s $6,000 scenario could become a base case if de-dollarization accelerates [T3][T2].
- Base Case: The Federal Reserve maintains a hawkish stance, keeping real yields elevated. Gold consolidates between 4,000 and 4,500 EUR, supported by continued central bank buying [T6][T1].
- Bearish Scenario: Inflation reaccelerates, forcing the Fed to raise rates further. A strong U.S. dollar and technical breakdown below 200-day support could test levels near 3,600 EUR [T7][T8].
Valuation Discussion
Gold is currently trading at a discount to its recent highs but remains above its long-term trend. The current price of 3,740.04 EUR represents a 20% drawdown from the January ATH of 4,688.32 EUR. Analyst consensus targets range from 4,242 to 4,610 EUR [T3]. The breach of the 200-day moving average suggests the market is currently overcorrecting, creating a potential buying opportunity for long-term holders, though short-term volatility remains high.
Risks
- Hawkish Fed Pivot: UBS identifies a hawkish Fed pivot as the primary downside risk. If inflation forces the Fed to pause rate cuts, real yields would rise and pressure gold prices [T3].
- Geopolitical Escalation: Continued conflict in the Middle East could keep energy prices elevated, reinforcing the narrative that rates will stay higher for longer [T7].
- Technical Breakdown: Gold is approaching a close below its 200-day moving average for the first time since October 2023. A failure to reclaim this level could trigger further stop-loss selling [T8].
Appendix
- Central banks see gold as the reserve asset of choice – ECB report – KITCO [T1]
- Fed trapped between inflation and debt crisis, and gold wins either way – KITCO [T2]
- Gold at the crossroads: catalysts and outlook for the second half of 2026 – KITCO [T3]
- Central banks buy net 17 tonnes of gold in April, led by Poland and China – KITCO [T4]
- Why gold is now more like a risk asset – Axios [T5]
- Gold breaks below key technical support, but analysts see a buying opportunity – KITCO [T6]
- Gold price erases year’s gains as rate hike chances surge – Mining.com [T7]
- Gold SWOT: China’s GFEX is exploring night trading for platinum and palladium contracts – KITCO [T8]
This report is AI-generated for informational purposes only and does not constitute investment advice. Readers should conduct their own due diligence before making investment decisions.
Important Note / Wichtiger Hinweis:
EN: This report may have been generated using AI. It processes data from publicly available sources. The content is provided for informational purposes only.DE: Dieser Bericht kann mithilfe von KI erstellt worden sein. Dabei werden Daten aus öffentlich zugänglichen Quellen verarbeitet. Die Inhalte dienen ausschließlich Informationszwecken.
* DE: Die ergänzenden Inhalte können KI-generiert sein. EN: The additional content may be AI-generated.