
Listen to the summary
Key Data Snapshot
| Indicator | Value | Context |
|---|---|---|
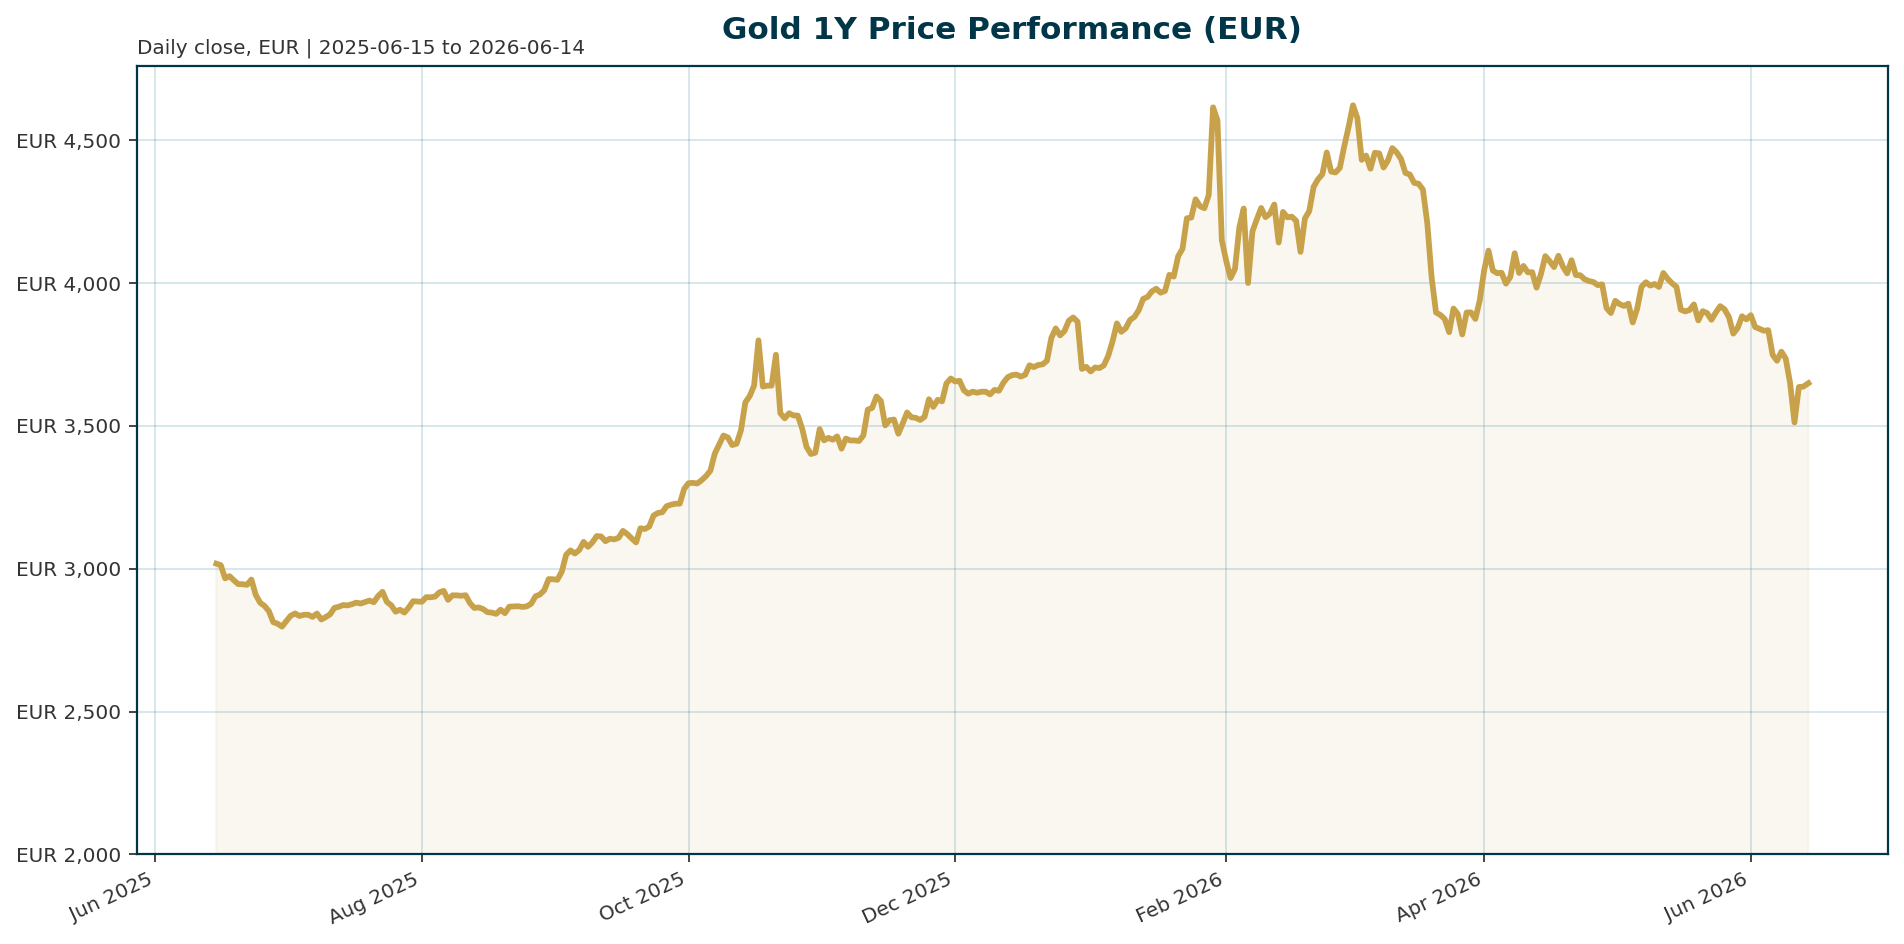
| XAU/EUR Price | 3,649.44 | Current spot price |
| ATH (All-Time High) | 4,688.32 | >Set on 2026-01-29|
| ATH Drawdown | -22.16% | Consolidation phase |
| 1-Year Return | +21.87% | Strong long-term performance |
| 200-Day Return | +1.71% | Recent stabilization |
| Euro Area 10Y Yield | 3.08% | Down 69.71 bp over 1 month |
| BTC Dominance | 56.57% | Market share of crypto assets |
Macro Backdrop
Global equity markets show mixed momentum with the Nikkei 225 leading on a 5-day basis at 3.12% while the Nasdaq Composite lags at -0.16% [T1]. The Euro Stoxx 50 is the strongest 1-month performer at 5.57%, suggesting European equities are outpacing US peers. In the fixed income space, the Euro area AAA 10-year yield sits at 3.08%, having declined 69.71 basis points over the past month, contrasting with US yields that have climbed to pre-global financial crisis levels [T1][T2]. The EUR/USD pair is trading at 1.1566, showing slight resilience against the dollar. This divergence suggests that while global risk sentiment is neutral to positive, the Euro area’s falling yields provide a supportive backdrop for EUR-denominated gold by reducing the opportunity cost of holding a non-yielding asset relative to Euro-denominated bonds.Investment Thesis
The investment thesis for gold rests on a structural shift from a yield-seeking regime to a purchasing power preservation regime. As governments accumulate liabilities faster than economies can grow, policymakers face difficult choices between fiscal austerity, higher inflation, financial repression, or debt monetization [T1][T2]. In this environment, gold transitions from a simple inflation hedge to a store of value independent of the financial system. The current market reflects a “debasement trade” where investors are reallocating from fiat currencies and sovereign debt into hard assets [T4]. The narrative posits that real yields are difficult to sustain at positive levels due to rising sovereign debt supply and structural demand shifts, making gold the ultimate collateral asset in a system where policy increasingly prioritizes bond market stability over inflation control [T4].Bullish Drivers
- Central Bank Accumulation: Central banks remain the primary demand engine, buying a net 244 tonnes in Q1 2026, which exceeds quarterly averages [T4]. This diversification away from US Treasuries highlights gold’s role as core collateral during stress periods.
- Real Yield Compression: WisdomTree’s Nitesh Shah argues that inflation risks may outpace the Federal Reserve’s ability to respond, potentially pushing real interest rates deeper into negative territory [T3]. This would remove the headwind of high opportunity costs for non-yielding assets.
- Supply Constraints: Mine supply growth is limited, while central banks absorb a significant share of newly available metal [T1][T2]. This supply-demand imbalance supports the structural floor for prices.
- Turkey’s Rotation: The liquidation of an estimated $14 billion in US Treasuries by Turkey and the use of gold swaps rather than outright sales underscores the functional hierarchy of reserve assets, favoring gold in times of liquidity stress [T4].
Relative Positioning vs Bitcoin and Ethereum
Bitcoin dominance remains elevated at 56.57%, indicating that capital is rotating into digital hard assets rather than traditional safe havens like gold [T1]. While gold acts as the primary reserve asset anchor amidst crypto volatility, the high beta nature of Bitcoin and Ethereum creates a competitive dynamic. If Bitcoin dominance continues to rise, gold may face headwinds as investors view it as a less efficient store of value compared to digital counterparts. However, the current market cap of gold (~1.67B EUR) remains significantly larger than the total crypto market cap (~1.97T EUR), suggesting gold retains the liquidity and institutional acceptance necessary to serve as the systemic “hard money” anchor.Scenario Framework
- Bullish Scenario: Inflation pressures sustain above target, forcing the Fed to abandon balance sheet reduction plans. Real yields collapse, and the “debasement trade” accelerates, driving gold back toward its January 2026 ATH of 4,688.32 EUR.
- Bearish Scenario: The Fed maintains a hawkish stance, keeping rates higher for longer. US long-term yields rise further, strengthening the dollar and increasing real yields globally. Gold tests support near the 200-day moving average.
- Stagflationary Trap: Geopolitical events (e.g., energy price spikes) drive inflation higher while economic growth slows. This scenario creates a mixed signal where gold’s inflation hedge competes with elevated real yields, capping upside in the short term [T5].
Valuation Discussion
Gold is currently trading at 3,649.44 EUR, representing a 22.16% drawdown from its January 2026 all-time high of 4,688.32 EUR. Despite the recent correction, the 1-year return stands at +21.87%, and the 200-day return is positive at +1.71%. Citigroup recently lowered its 3-month target from 4,300 EUR to 4,000 EUR, citing improved macroeconomic conditions and less supportive demand [T7]. However, given the structural supply constraints and robust central bank buying, current valuations appear attractive relative to the long-term trend. The market is digesting a sharp rally, and the current price level offers a compelling entry point for the “debasement trade” narrative to resume.Risks
- Real Yield Persistence: If inflation expectations remain anchored while the Fed successfully tightens policy, real yields could remain elevated. This would increase the opportunity cost of holding gold, potentially triggering further profit-taking after the sharp previous rallies [T6][T7].
- Geopolitical “Distortion”: Geopolitical events that raise energy prices can paradoxically strengthen the dollar and reinforce hawkish Fed policy, acting as a headwind for gold rather than a tailwind [T6][T8].
- Profit Taking: The sharp increase in gold prices prior to the current consolidation has likely triggered significant profit-taking, adding short-term volatility risk [T7].
Appendix
Sources
- Debt cycle points to stronger case for gold price: Sprott – Bitget [T1]
- Debt cycle points to stronger case for gold price: Sprott – Mining.com [T2]
- Rising inflation may push real rates lower, setting the stage for gold’s next rally – WisdomTree’s Shah – KITCO [T3]
- Gold and silver will gain as rising debt and inflation reprice bonds and the broader market – Sprott’s Wong – KITCO [T4]
- Gold Price Momentum Amid Geopolitical Headwinds in 2026 – Discovery Alert [T5]
- Gold and Silver Bleed 23% and 44% Despite US-Iran War and Rising CPI – Bitcoin News [T6]
- Reasons for the recent sharp drop in gold prices – Laodong.vn [T7]
- Gold Falls as Geopolitical Tensions Spark Inflation Concerns – WSJ [T8]
This report is AI-generated for informational purposes only and does not constitute investment advice. The views expressed herein are those of the AI assistant and do not reflect the official positions of any financial institution or regulatory body. Readers should conduct their own due diligence before making investment decisions.
Important Note / Wichtiger Hinweis:
EN: This report may have been generated using AI. It processes data from publicly available sources. The content is provided for informational purposes only.DE: Dieser Bericht kann mithilfe von KI erstellt worden sein. Dabei werden Daten aus öffentlich zugänglichen Quellen verarbeitet. Die Inhalte dienen ausschließlich Informationszwecken.
* DE: Die ergänzenden Inhalte können KI-generiert sein. EN: The additional content may be AI-generated.