
Listen to the summary
Key Data Snapshot
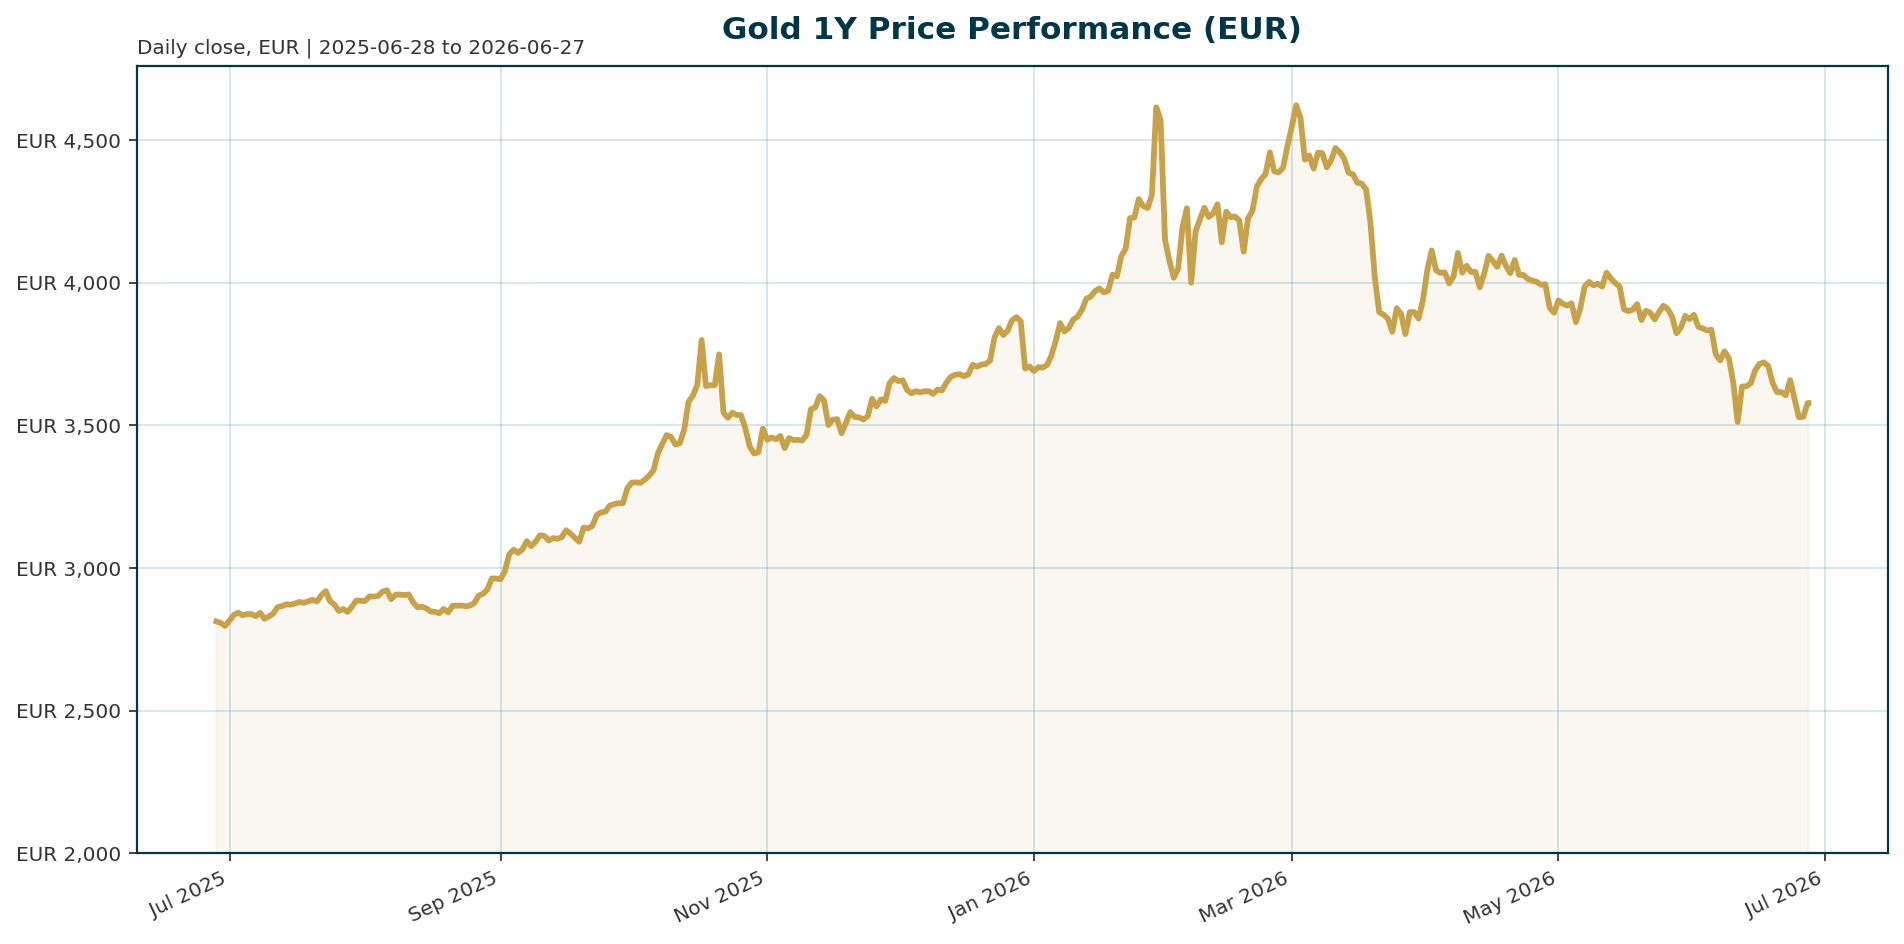
Gold (XAU) trades at 3578.11 EUR, reflecting a 23.70% drawdown from its January 2026 all-time high of 4688.32 EUR. The asset has experienced a 5.16% pullback over the past 30 days, though it remains up 25.87% over the last year. Market capitalization stands at approximately 1.62 billion EUR with a 24-hour volume of 104.35 million EUR.
| Metric | Value |
|---|---|
| Current Price (XAU/EUR) | 3,578.11 |
| All-Time High (ATH) | 4,688.32 EUR (-23.70% drawdown) |
| 30-Day Performance | -5.16% |
| 1-Year Performance | +25.87% |
| Market Cap | 1.62 Billion EUR |
| 24h Volume | 104.35 Million EUR |
| BTC Dominance | 55.74% |
Calculation: Drawdown % = (ATH – Current Price) / ATH = (4688.32 – 3578.11) / 4688.32 = 23.70%.
Macro Backdrop
Risk sentiment is currently neutral to negative. The Euro area rate backdrop is supportive for gold, with euro yields falling as the AAA 10Y yield sits at 2.92% and has dropped 12.1 bp over the last 5 days. The FX backdrop is mixed, with EUR/USD at 1.1391 and down 0.38% over the same period. Key observations highlight a divergence in equity performance, with the DAX outperforming global peers at 0.04% versus -3.42% for global equity indicators, while the Hang Seng lags significantly at -4.61%.
Investment Thesis
The investment thesis for gold pivots away from traditional rate sensitivity toward structural geoeconomic forces. The primary argument centers on the weaponization of the dollar and the resulting de-dollarization trend, which has driven central banks to diversify reserves aggressively [T1]. Analysts argue that inflation will remain structurally higher than pre-pandemic levels due to reshoring and supply-chain realignment, undermining the case for low real yields [T1]. Consequently, gold is viewed not as a cyclical rate play but as a critical hedge against reserve currency risk and geopolitical fragmentation [T2].
Bullish Drivers
- Structural Sovereign Demand: Central bank net purchasing of 800 to 1,000 tonnes annually represents a structural demand floor, consuming approximately 25 to 30% of annual global mine output [T2]. A survey of central banks shows 45% plan to increase reserves, the highest share since 2018 [T5].
- Supply Constraints: With global mine production fixed at approximately 3,500 tonnes per year, the scale of sovereign accumulation creates a price support mechanism independent of speculative positioning [T2].
- Valuation Reset: The 29% decline from the January peak has pushed more than 200 tons of gold in ETFs into loss-making territory, potentially signaling a capitulation bottom [T4].
- Non-Traditional Buyers: The emergence of entities like Tether as new gold buyers adds a layer of liquidity support to the market [T5].
Relative Positioning vs Bitcoin and Ethereum
Gold is exhibiting decoupling behavior from the broader crypto asset class. While Bitcoin dominance remains elevated at 55.74%, gold is benefiting from reserve diversification trends that differ from the rate-shock sensitivity of cryptocurrencies [T7]. As gold acts as a hedge against the “weaponization of the dollar” [T1], it may attract capital from digital assets during periods of geopolitical stress, offering a distinct risk profile compared to the highly volatile tech sector.
Scenario Framework
- Base Case: The Federal Reserve remains hawkish under Chair Warsh, with real yields rising and the dollar strengthening. Gold consolidates around the $4,000 support zone (EUR ~4550) as central bank buying offsets ETF outflows [T3][T6].
- Bull Case: De-dollarization accelerates and the Fed signals a pivot. If oil flows resume and sovereign capital flows back into gold, prices could break the January 2026 ATH [T1][T2].
- Bear Case: Real yields spike above 4.5% and inflation expectations drop. This triggers renewed ETF outflows, pushing gold below the $3,900 support level (EUR ~4440) [T4][T7].
Valuation Discussion
Current levels offer an attractive entry point following a sharp 29% correction from the January record high [T4]. The market is pricing in significant Fed hawkishness, yet analysts note it is difficult to envision gold spending a prolonged period below $4,000 per ounce due to the structural demand floor provided by central banks [T6]. The recent bounce off the $3,900 to $4,100 support zone suggests the downside risk is contained, provided geopolitical tensions do not escalate further [T3].
Risks
- Monetary Policy Tightening: A hawkish stance from the Federal Reserve, including potential rate hikes, raises the opportunity cost of holding non-yielding gold [T5][T7].
- ETF Liquidation: Continued net outflows from gold-backed ETFs, which saw 16 tonnes exit in May, could exacerbate short-term price weakness if rate expectations remain elevated [T4].
- Dollar Strength: A renewed “American Exceptionalism” trade driven by resilient economic activity could strengthen the dollar, putting additional pressure on gold prices [T6].
Appendix
Sources
- Gold’s pullback creates attractive entry as de-dollarization turns structural – KITCO [T1]
- Why Central Bank Gold Demand Is Reshaping Global Reserves – Discovery Alert [T2]
- Bears abound on Wall Street and Main Street as markets digest Fed’s hawkish bias – KITCO [T3]
- Gold ETFs could see fresh outflows on rising bets on Fed monetary tightening – Reuters [T4]
- Gold SWOT: Tether has emerged as a new gold buyer – KITCO [T5]
- Gold faces make-or-break week at $4,000 as Fed hawkishness fuels bearish outlook – KITCO [T6]
- Goldman Sachs picks best hedges for a rate-shock scenario – CNBC [T7]
Disclaimer: This report is AI-generated for informational purposes only and does not constitute investment advice. The analysis is based on data available up to June 27, 2026, and may become stale or inaccurate over time. Readers should conduct their own due diligence before making investment decisions.
Important Note / Wichtiger Hinweis:
EN: This report may have been generated using AI. It processes data from publicly available sources. The content is provided for informational purposes only.DE: Dieser Bericht kann mithilfe von KI erstellt worden sein. Dabei werden Daten aus öffentlich zugänglichen Quellen verarbeitet. Die Inhalte dienen ausschließlich Informationszwecken.
* DE: Die ergänzenden Inhalte können KI-generiert sein. EN: The additional content may be AI-generated.