
Listen to the summary
Key Data Snapshot
| Metric | Value | Context |
|---|---|---|
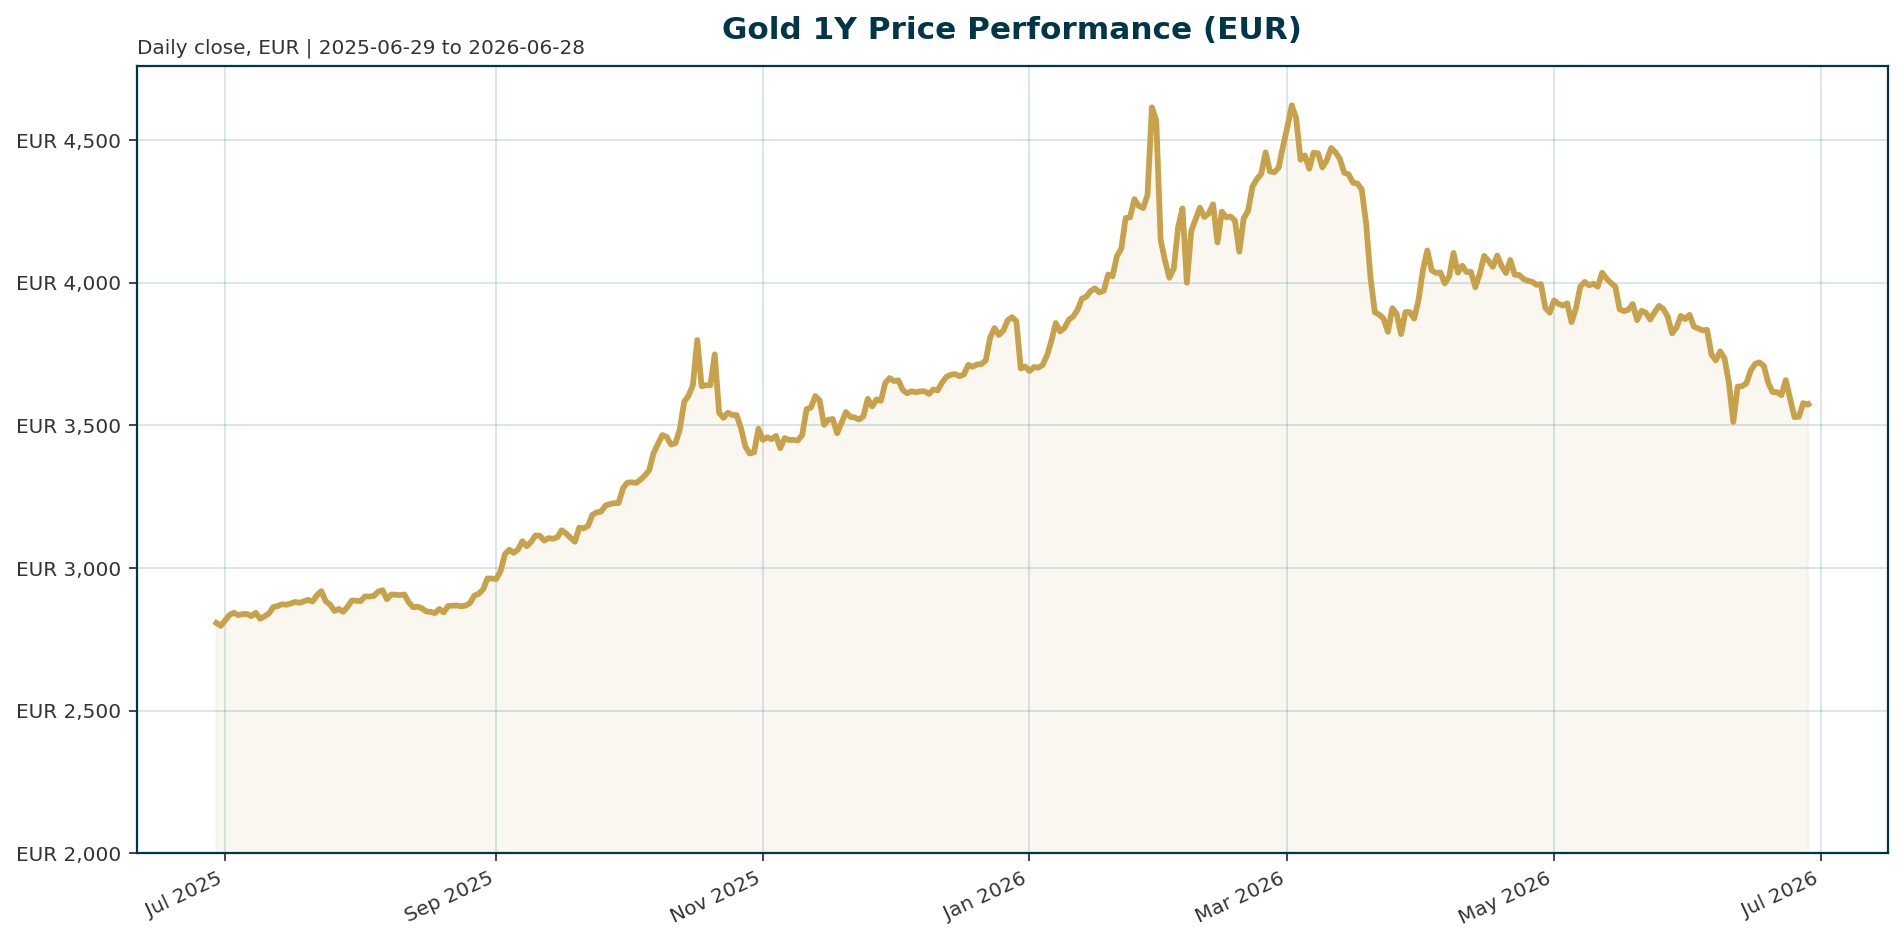
| Spot Price (XAU/EUR) | 3,574.26 | Current market rate |
| 1-Year Performance | +27.05% | Strong year-to-date gains |
| Drawdown from ATH | -23.77% | From January 2026 peak of 4,688.32 EUR |
| BTC Dominance | 55.85% | Bitcoin’s share of total crypto market cap |
| Euro Area 10Y Yield | 2.92% | Falling 12.1 basis points over 5 days |
Macro Backdrop
The macro backdrop presents a neutral to negative risk sentiment with DACH equities outperforming global peers. The Euro area yield curve is falling, with the AAA 10Y yield at 2.92% and down 12.1 basis points over five days. The EUR/USD pair sits at 1.1394, showing mixed performance, while equity momentum is led by the DAX at 0.04% versus the weak Hang Seng at -4.61%.
Investment Thesis
The primary investment thesis for gold centers on structural de-dollarization and the persistence of geopolitical fragmentation. Goldman Sachs maintains gold as its highest conviction long commodity position, identifying central bank purchasing as the dominant structural driver [T2]. Unlike traditional rate-sensitive commodities, gold benefits from the shift away from dollar-denominated assets. The “weaponization of the dollar” has catalyzed a reserve diversification trend where central banks seek stores of value outside the U.S. Treasury market [T1]. As globalization reverses and supply chains realign, inflation is expected to remain structurally higher than pre-pandemic levels, further supporting gold’s role as a hedge against currency debasement [T1].
Bullish Drivers
- Structural Demand Floor: Central bank net purchasing of 800 to 1,000+ tonnes annually represents approximately 25 to 30% of global mine output, creating a price support mechanism independent of speculative flows [T2]. A survey indicates 45% of central banks plan to increase reserves in the coming year, the highest share since 2018 [T5].
- Tether Accumulation: Tether has emerged as a new significant buyer of gold, adding to the demand base [T5].
- Favorable Euro Yields: The Euro area yield curve is falling, with the 10Y yield at 2.92%. A falling yield curve in the Eurozone enhances the relative attractiveness of EUR-denominated gold.
- Geopolitical Uncertainty: Reduced central bank transparency and mounting market risks, including private debt and AI complexities, reinforce the long-term case for gold as a store of value [T8].
Relative Positioning vs Bitcoin and Ethereum
Gold currently trades in a correction phase following its January 2026 all-time high, down 23.77% from the peak of 4,688.32 EUR [T4]. In contrast, Bitcoin dominance stands at 55.85%, suggesting a high allocation to digital assets within the broader risk-on portfolio. While Bitcoin and Ethereum have driven the 2025 rally, gold remains the primary reserve asset and safe haven. The divergence suggests that as market volatility returns, capital may rotate from high-volatility crypto assets back into the liquidity and stability of gold.
Scenario Framework
- Bullish Scenario: If the U.S. Federal Reserve pivots to rate cuts and Euro area yields continue to decline, the opportunity cost of holding gold diminishes. Additionally, normalization of oil flows could trigger sovereign buying as capital flows away from Treasuries and into gold [T1].
- Bearish Scenario: Persistent hawkish bias from the Federal Reserve, with Chair Kevin Warsh signaling aggressive rate hikes, could weigh heavily on gold. A stronger dollar and elevated real yields would likely push prices toward the $3,800 support level [T3][T6].
- Base Case: Inflation remains sticky and geopolitical risks persist. Gold consolidates within a $3,900 to $4,100 range. The structural demand from central banks offsets the headwind of ETF outflows and rate expectations.
Valuation Discussion
Gold is currently priced at 3,574.26 EUR, representing a 29% pullback from its January 2026 record high of 5,594.82 EUR [T4]. At current levels, more than 200 tons of gold in exchange-traded funds are in loss-making territory [T4]. This technical distress, combined with a 16-ton net outflow in May, suggests the market has priced in significant pessimism. However, the structural demand floor from central banks provides a strong basis for valuation support. Technical analysis indicates a major support zone between $3,900 and $4,100 [T3], implying the current price offers an attractive entry point relative to the structural long-term demand thesis.
Risks
- Monetary Policy Tightening: The Fed’s hawkish stance and elevated two-year Treasury yields (hovering around 4.22%) pose a significant headwind to non-yielding assets like gold [T5][T6].
- ETF Outflows: Continued speculative selling and ETF outflows could exacerbate price declines, particularly if the Fed maintains a restrictive policy stance [T4].
- Market Complexity: New risks, including artificial intelligence, misinformation, and opaque private debt structures, could increase systemic volatility, potentially triggering a flight to quality that benefits gold [T8].
Appendix
Sources
- Gold’s pullback creates attractive entry as de-dollarization turns structural – KITCO [T1]
- Why Central Bank Gold Demand Is Reshaping Global Reserves – Discovery Alert [T2]
- Bears abound on Wall Street and Main Street as markets digest Fed’s hawkish bias – KITCO [T3]
- Gold ETFs could see fresh outflows on rising bets on Fed monetary tightening – Reuters [T4]
- Gold SWOT: Tether has emerged as a new gold buyer – KITCO [T5]
- Goldman Sachs picks best hedges for a rate-shock scenario – CNBC [T6]
- Gold & silver market update: Silver below $60, gold $4,100 test, ETF selling, Comex inventories – KITCO [T7]
- Gold and Silver Face Fresh Warning Signs as New Market Risks Build Fast – Qoo Media [T8]
This report is AI-generated for informational purposes only and does not constitute investment advice. The views expressed herein are those of the model and should not be taken as financial recommendations. Always conduct your own research and consult with a qualified professional before making investment decisions.
Important Note / Wichtiger Hinweis:
EN: This report may have been generated using AI. It processes data from publicly available sources. The content is provided for informational purposes only.DE: Dieser Bericht kann mithilfe von KI erstellt worden sein. Dabei werden Daten aus öffentlich zugänglichen Quellen verarbeitet. Die Inhalte dienen ausschließlich Informationszwecken.
* DE: Die ergänzenden Inhalte können KI-generiert sein. EN: The additional content may be AI-generated.