
Listen to the summary
Key Data Snapshot
| Metric | Value | Change (Period) |
|---|---|---|
| Price (XAU/EUR) | 3,563.18 | -0.30% (24h) |
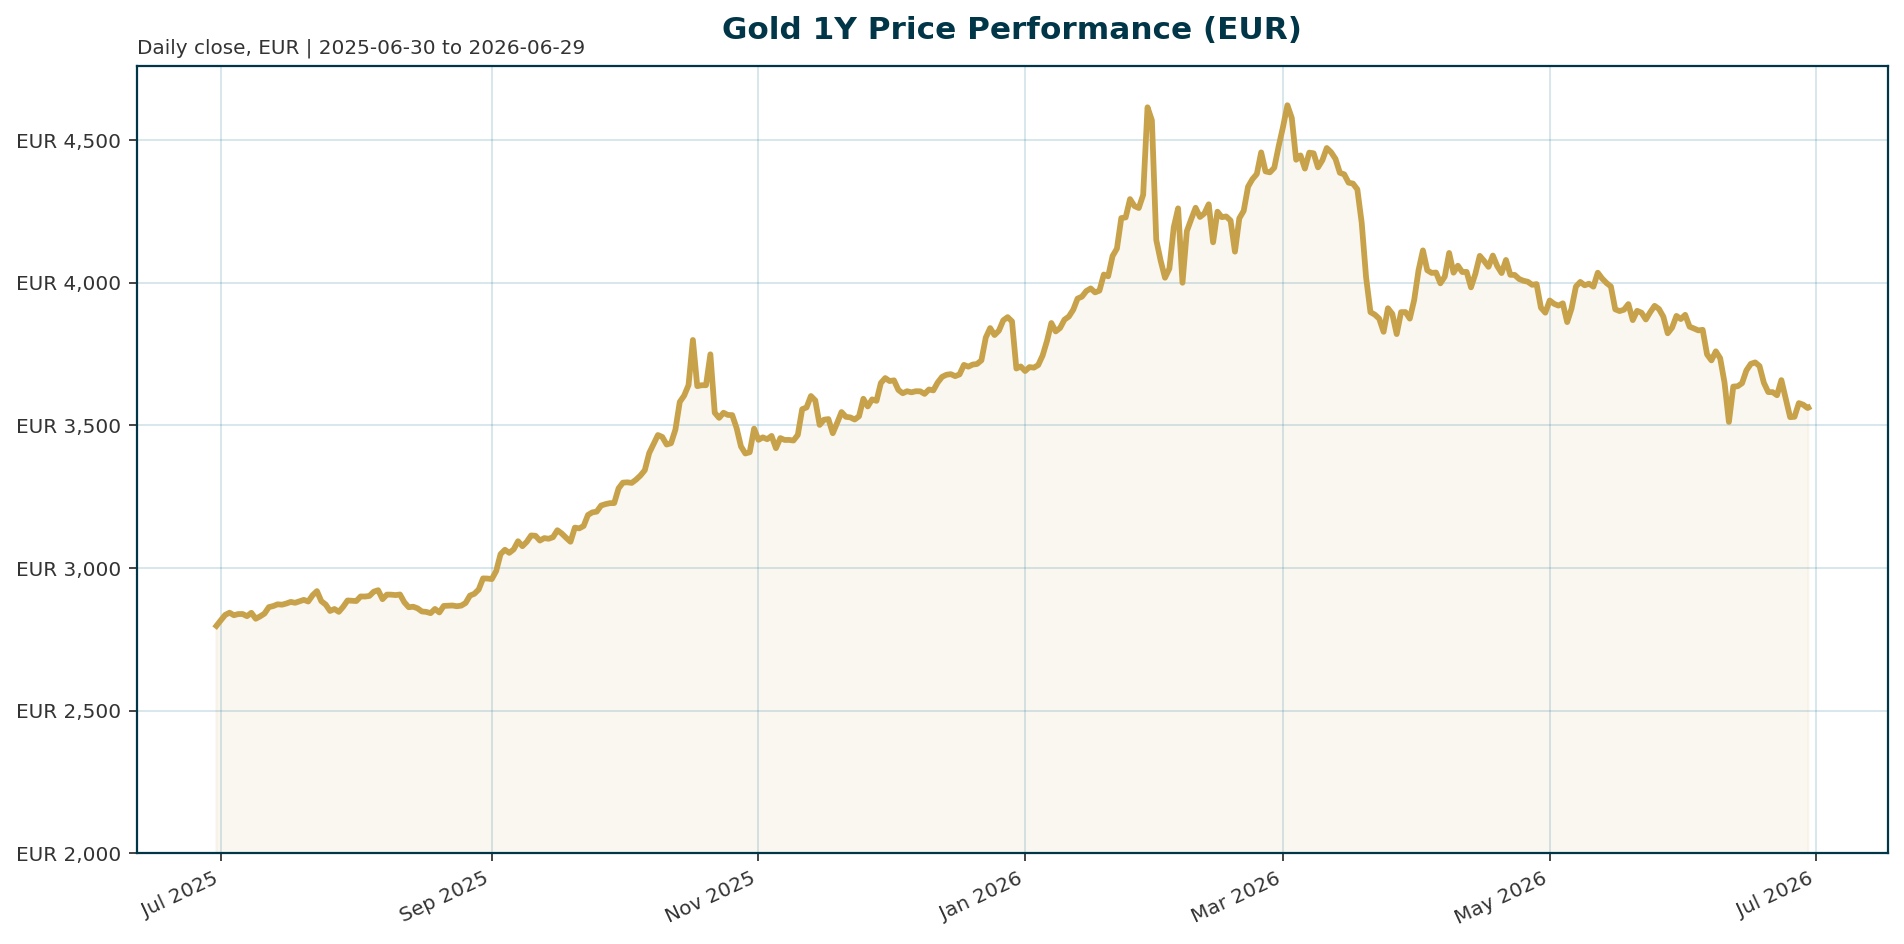
| ATH (EUR) | 4,688.32 | -23.94% (Jan 2026) |
| 30-Day Change | -8.24% | |
| YTD Change | +26.82% | |
| BTC Dominance | 55.64% | |
| Central Bank Demand | 25-30% of supply | Structural floor |
The current price of 3,563.18 EUR represents a 76% reversion from the January 2026 all-time high of 4,688.32 EUR. Despite the recent drawdown, the asset remains up 26.82% year-to-date. The structural demand floor is supported by central bank net purchasing, which absorbs approximately 25 to 30% of annual mine output.
Macro Backdrop
Risk sentiment is currently neutral to negative, with global equities showing mixed performance. The Nasdaq Composite is the weakest major index, down 3.32% over five days, while the Nikkei 225 has dropped 1.04% [T3]. The Euro area offers a marginally more favorable backdrop for gold as Euro area AAA 10Y yields continue to fall, recently moving -12.07 basis points over five days to 2.92% [T3]. Conversely, the US Federal Reserve has adopted a hawkish tone under Chair Kevin Warsh, with markets pricing in a greater than 70% chance of a rate hike by September [T1]. This divergence creates a complex environment where Euro-denominated gold benefits from falling local yields, while US rate hikes present a headwind.
Investment Thesis
The investment thesis for Gold is bifurcated between cyclical headwinds and structural tailwinds. The cyclical component is currently dominant, driven by the Fed’s hawkish pivot and rising real yields, which increase the opportunity cost of holding non-yielding bullion [T1][T4]. However, the structural thesis remains intact. Goldman Sachs maintains gold as its highest-conviction long commodity position, citing central bank purchasing as the primary driver [T2]. The narrative of reserve diversification away from the US dollar is gaining traction, supported by a US fiscal deficit running at approximately 6% of GDP and declining foreign holdings of Treasuries [T1]. This structural shift suggests that while short-term price action is dictated by monetary policy, the long-term trajectory is anchored by sovereign demand.
Bullish Drivers
Several factors support the long-term bullish case for Gold. The most significant is the acceleration of central bank diversification. An Invesco survey of $29 trillion in sovereign assets found that 61% of central banks believe US debt negatively impacts the dollar’s long-term reserve role, and one-third plan to increase gold holdings [T8]. Additionally, the People’s Bank of China (PBoC) remains a critical variable; a recent dip in Chinese liquidity has weighed on gold, but analysts argue the PBoC has little choice but to resume monetary stimulus to avoid a Japanese-style lost decade [T6]. This would likely reignite physical demand from Chinese investors hedging against devaluation. Geopolitical fragmentation, exemplified by the Iran war and energy crisis, ensures inflation pressures remain sticky, supporting the “debasement trade” [T1].
Relative Positioning vs Bitcoin and Ethereum
Gold is currently underperforming risk assets relative to its typical safe-haven status. The 30-day decline of -8.24% contrasts with the Nasdaq Composite’s -3.32% decline over five days, indicating that investors are currently tolerating risk assets despite the Fed’s hawkish signals [T3]. Bitcoin dominance stands at 55.64%, suggesting that capital is flowing into riskier crypto assets rather than traditional safe havens. However, the correlation between Gold and equities remains high, implying that Gold is currently being priced as a cyclical commodity rather than a defensive hedge.
Scenario Framework
Base Case (Hawkish Stalemate): The Fed follows through on rate hikes as expected, keeping real yields elevated. Gold consolidates around current levels, with central bank buying absorbing selling pressure. The Euro area yield curve continues to flatten, providing modest support for EUR-denominated gold.
Bull Case (De-dollarization Breakout): Geopolitical tensions escalate or US debt concerns force a reassessment of dollar dominance. Central bank buying surges, potentially pushing Gold above its ATH of 4,688.32 EUR. A resumption of PBoC stimulus could trigger a rapid rally in physical demand.
Bear Case (Macro Pivot): The Fed maintains a hawkish stance for an extended period, and the US dollar strengthens significantly. Gold breaks below the critical $3,900 USD support zone (approx. 4,450 EUR) on ETF selling and profit-taking, testing the structural demand floor.
Valuation Discussion
Gold is currently trading at approximately 76% of its all-time high, offering a margin of safety for buyers if the structural demand thesis holds. The recent dip below US$3,960 (approx. 4,517 EUR) briefly tested the October-November lows, but the market has since bounced off a support zone between $3,900 and $4,100 USD [T3]. The structural demand floor created by central banks—consuming 25 to 30% of annual supply—implies a higher valuation floor than historical averages. Given the Euro area yield decline, the current valuation in EUR terms appears attractive relative to the cost of holding European bonds.
Risks
The primary risk to the Gold thesis is the persistence of the Fed’s hawkish monetary policy. Chair Kevin Warsh’s hawkish debut has led to a sharp repricing of rate hikes, with two-year Treasury yields jumping the most since April 2025 [T4]. If real yields continue to rise, the opportunity cost of holding Gold will increase, potentially triggering a deeper correction. Additionally, a sharp reversal in Chinese monetary policy or a sudden strengthening of the US Dollar could overwhelm the structural de-dollarization trend. Finally, a broad-based risk-off event where investors flee all hard assets simultaneously could lead to a liquidity crunch in the gold market.
Appendix
Sources:
- Bank of America says gold can still hit $6,000, just not anytime soon – KITCO [T1]
- Why Central Bank Gold Demand Is Reshaping Global Reserves – Discovery Alert [T2]
- Bears abound on Wall Street and Main Street as markets digest Fed’s hawkish bias – KITCO [T3]
- Gold SWOT: Tether has emerged as a new gold buyer – KITCO [T4]
- Gold Falls; Macro Challenges to Persist in Near Term – WSJ [T5]
- Gold’s most important variable revealed – Mining.com.au [T6]
- Gold & silver market update: Silver below $60, gold $4,100 test, ETF selling, Comex inventories – KITCO [T7]
- Sovereign investors with $29 trillion pivot to energy assets, flag dollar fears – Reuters [T8]
This report is AI-generated for informational purposes only and does not constitute investment advice. The analysis is based on data retrieved as of June 29, 2026, and should not be considered as a recommendation to buy or sell any financial instrument.
Important Note / Wichtiger Hinweis:
EN: This report may have been generated using AI. It processes data from publicly available sources. The content is provided for informational purposes only.DE: Dieser Bericht kann mithilfe von KI erstellt worden sein. Dabei werden Daten aus öffentlich zugänglichen Quellen verarbeitet. Die Inhalte dienen ausschließlich Informationszwecken.
* DE: Die ergänzenden Inhalte können KI-generiert sein. EN: The additional content may be AI-generated.