
Listen to the summary
Key Data Snapshot
| Metric | Value |
|---|---|
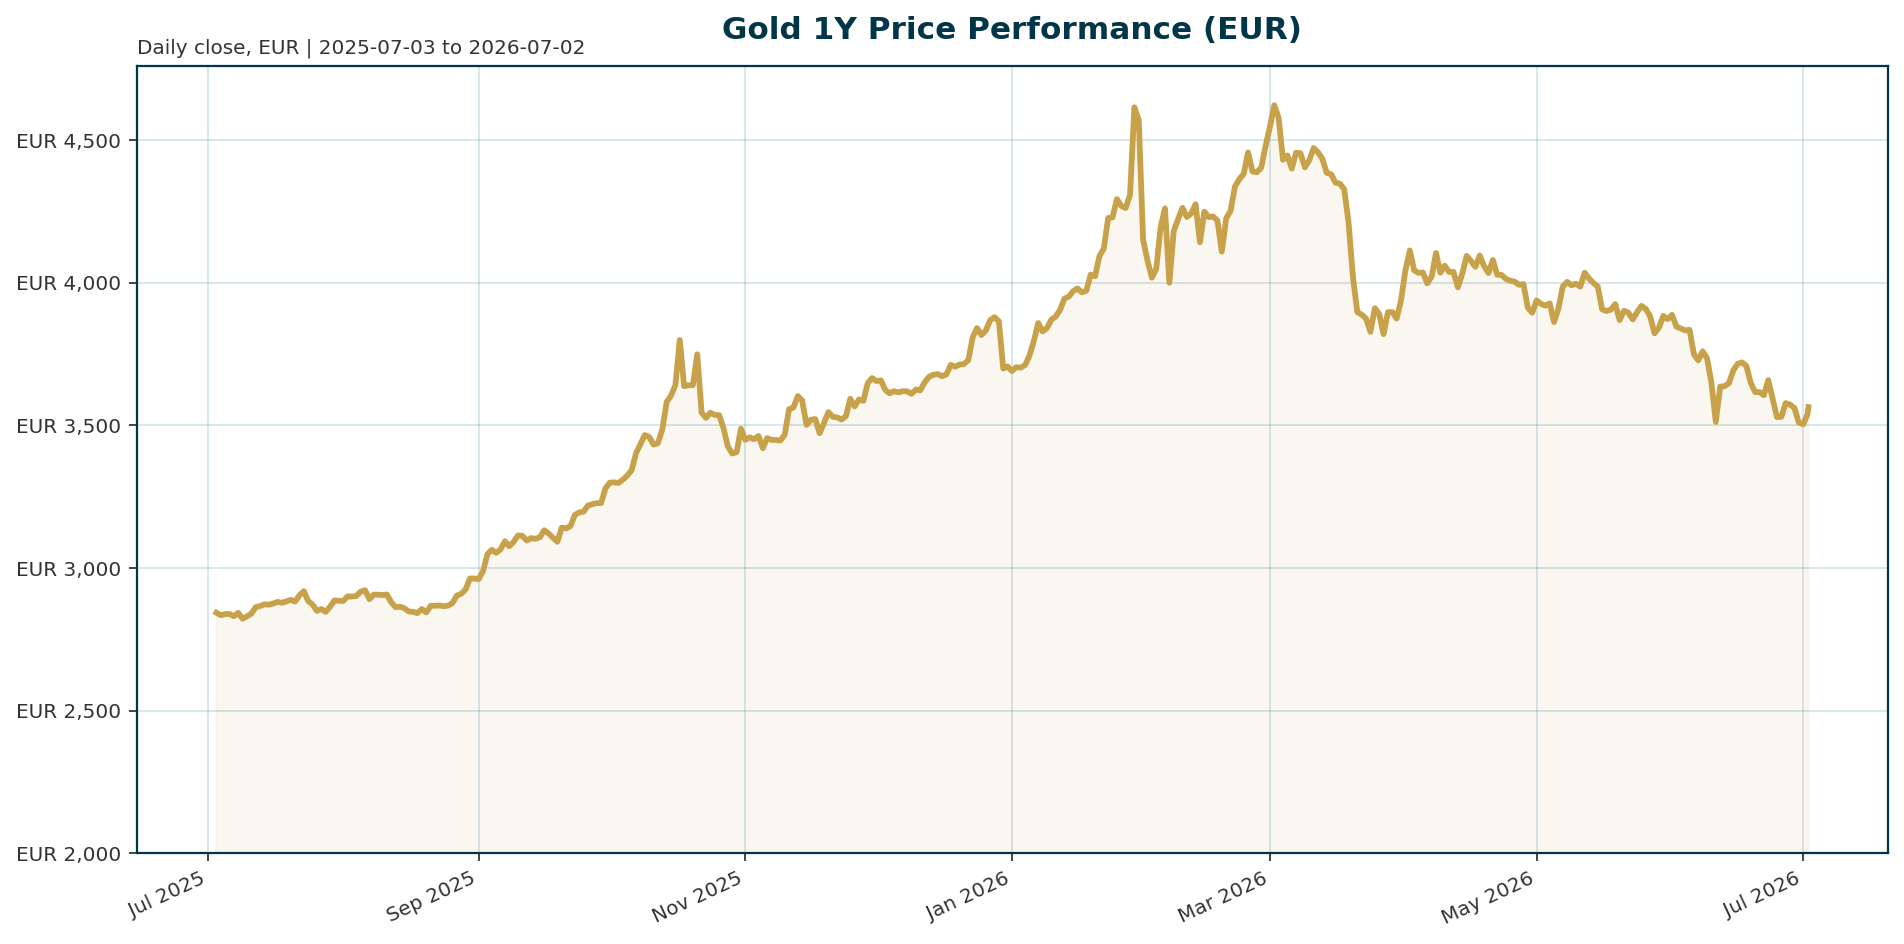
| Current Price (XAU/EUR) | 3,565.02 |
| 24h Change | +2.36% |
| 30-Day Change | -7.56% |
| YTD Change | +25.84% |
| All-Time High (ATH) | 4,688.32 (Jan 2026) |
| ATH Change | -23.92% |
| Market Cap | 1.61B EUR |
| 24h Volume | 154.13M EUR |
Macro Backdrop
Risk sentiment is currently neutral as global equities show mixed momentum, with the Nasdaq Composite leading gains while DACH indices lag [market_overview]. The rates environment is mixed, with the Euro Area AAA 10Y yield holding at 2.92% [market_overview]. A significant shift has occurred in the monetary policy narrative, moving away from the “debasement trade” of early 2026. The Fed, under Chairman Warsh, has adopted a hawkish stance, pushing real yields higher and making gold less attractive relative to yield-bearing assets [T1][T4]. However, inflation is cooling, and growth appears to have peaked, setting the stage for a potential pivot from hawkish to dovish policy rather than further hikes [T1].Investment Thesis
The investment thesis for gold centers on a structural pivot in global reserves and a potential reversal in monetary policy. Despite the recent correction, gold remains in a “reset to setup” phase [T1]. The primary driver for a breakout is the expectation that the Fed will eventually pivot to dovish policy, which would alleviate the real yield headwind currently suppressing prices [T1]. Long-term, the thesis relies on the continued “debasement trade” driven by US fiscal deficits and the structural shift toward a multipolar global monetary system [T6].Bullish Drivers
Central bank demand remains the most robust structural bullish driver. 82% of central banks hold gold, and 61% expect prices to trade between $5,000 and $6,000 by June 2027 [T2]. These institutions are actively reducing dollar exposure in favor of alternative reserve assets, moving gold to the center of their strategy [T5]. Geopolitical risks, specifically the Middle East conflict and uncertainty surrounding US foreign policy, reinforce gold’s role as a safe haven asset [T2]. Additionally, a potential resumption of monetary stimulus by the People’s Bank of China to hedge against devaluation could drive domestic gold buying [T6].Relative Positioning vs Bitcoin and Ethereum
Gold currently occupies a distinct position relative to crypto assets. While Bitcoin and Ethereum are highly correlated with global tech performance and speculative risk sentiment, gold is driven primarily by real yields and geopolitical stability. In a neutral risk sentiment environment, gold acts as a stabilizer, whereas crypto assets are more sensitive to liquidity conditions. As real yields remain elevated, the opportunity cost of holding gold weighs on it relative to yield-bearing assets, though central bank support provides a unique floor not shared by speculative assets.Scenario Framework
- Base Case: Real yields remain above 2% through Q3, limiting upside. Gold trades rangebound between 3,500 and 3,800 EUR. The Fed maintains a neutral stance before cutting rates later in the year [T4][T3].
- Bull Case: The Fed pivots to dovish policy sooner than expected, causing real yields to fall. This triggers a breakout, with gold retesting its January ATH levels of 4,688.32 EUR [T1].
- Bear Case: Geopolitical tensions escalate or US real yields spike further. Gold tests support levels near 3,000 EUR, pressured by sustained opportunity costs and potential ETF selling [T6][T7].
Valuation Discussion
Gold is currently trading 23.9% below its January ATH but remains up 25.8% year-to-date. The pullback reflects the current hawkish Fed backdrop and elevated real yields. However, valuation appears attractive relative to the long-term “debasement trade” narrative and the expectations of central banks. Despite record prices, central banks remain net buyers, indicating that current levels may not fully price in the long-term shift toward a multipolar monetary system [T2][T3].Risks
The primary risk is the persistence of elevated real yields above 2% through Q3, which keeps the opportunity cost of holding gold high [T4]. A continued liquidity dip in China could exert additional downward pressure on prices [T6]. Short-term technical risks include ETF selling and stagnant Comex inventories, which suggest continued selling pressure in the near term [T7]. Finally, any escalation of the Middle East conflict could initially spike yields if risk aversion drives a flight to safety rather than gold.Appendix
Sources
- Gold and silver: From reset to setup heading into Q3 – KITCO [T1]
- Central banks see gold prices trading between $5,000 and $6,000 in 12 months – OMFIF Survey – KITCO [T2]
- These are the key factors that could restart the gold rally this year, or drive prices even lower – World Gold Council H2 Outlook – KITCO [T3]
- Gold’s biggest buyers aren’t slowing down, but SocGen sees a more measured pace ahead – KITCO [T4]
- For first time, more central banks are set to shrink dollar holdings, survey finds – Reuters [T5]
- Gold’s most important variable revealed – Mining.com.au [T6]
- Gold & silver market update: Silver below $60, gold $4,100 test, ETF selling, Comex inventories, and Treasury gold rumors – KITCO [T7]
- US labour demand remained firm in May – Financial Times [T8]
This report is AI-generated, for informational purposes only, and not investment advice.
Important Note / Wichtiger Hinweis:
EN: This report may have been generated using AI. It processes data from publicly available sources. The content is provided for informational purposes only.DE: Dieser Bericht kann mithilfe von KI erstellt worden sein. Dabei werden Daten aus öffentlich zugänglichen Quellen verarbeitet. Die Inhalte dienen ausschließlich Informationszwecken.
* DE: Die ergänzenden Inhalte können KI-generiert sein. EN: The additional content may be AI-generated.