
Listen to the summary
Key Data Snapshot
| Metric | Value | Context |
|---|---|---|
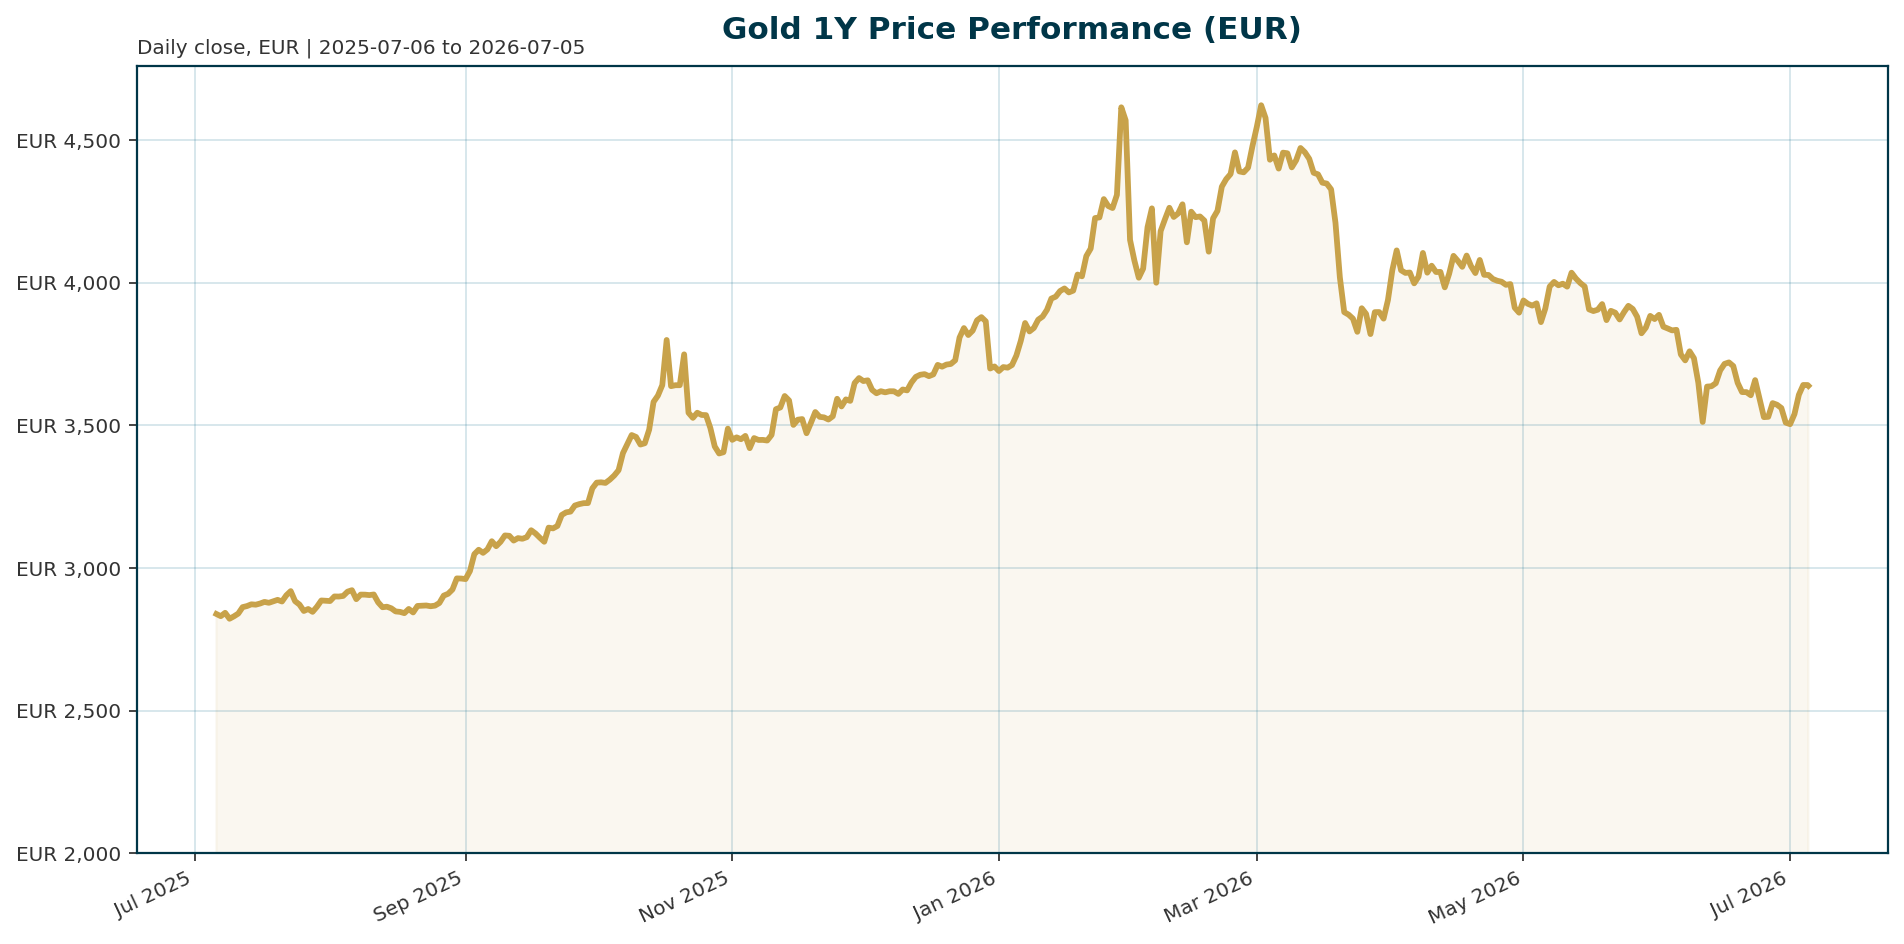
| Current Price (XAU/EUR) | 3,638.76 | >ATH: 4,688.32 EUR (Jan 29, 2026)|
| ATH Drawdown | -22.39% | >1Y Return: +28.11%|
| 24h Volume | 34.46M | >Market Cap: 1.65B EUR|
| EUR/USD | 1.1446 | >+0.34% (5d)|
| Euro Area 10Y Yield | 2.99% | >+6.6bp (5d), Curve Steepening
Macro Backdrop
Risk sentiment is neutral to positive, driven by robust performance in the DACH equity region, which is averaging 4.03% over five days versus 1.82% for global indicators. The DAX leads with a 5-day gain of 4.68%, while the ATX is up 7.71% on a 1-month basis, suggesting a risk-on environment that typically exerts downward pressure on gold. In the rates backdrop, the Euro area AAA 10Y yield sits at 2.99% with a steepening curve, while the USD remains resilient at 1.1446 despite a recent 0.34% weekly gain. This mix of strong European equities and rising yields creates a headwind for non-yielding assets, though recent dovish commentary from Fed Chair Warsh has temporarily injected life into the debasement trade [T8].
Investment Thesis
The primary investment thesis for gold remains anchored in structural reserve diversification rather than short-term rate speculation. Despite the recent hawkish pivot by the Fed, central banks are driving a long-term shift away from USD dominance toward a multipolar monetary system. Nearly 80% of reserve managers believe the global monetary system is evolving toward multipolarity, and gold has moved to the center of reserve management strategy, held by 82% of central banks [T6]. This structural demand is supported by geopolitical fragmentation, with the Middle East conflict cited as the top risk by 85% of respondents. Consequently, gold is viewed not merely as a hedge against inflation but as a critical reserve asset for liquidity and protection against systemic risk, a view reinforced by Goldman Sachs’ forecast that gold could approach $4,900 next year [T4].
Bullish Drivers
- Central Bank Optimism: The OMFIF survey reveals overwhelming constructive sentiment, with 61% of respondents expecting gold to trade between $5,000 and $6,000 by June 2027. A record 45% of central banks plan to increase their own gold holdings over the next 12 months [T2][T4].
- Debasement Trade Reversal: Fed Chair Kevin Warsh’s comments at the Sintra forum that inflation risks have come down have revived the debasement trade. This strategy, which bets on a weakening dollar and rising hard assets, helped propel gold beyond $5,000 and saw Bitcoin rally alongside it [T8].
- Positive Skew: Market positioning has turned, with the put-call skew flipping positive for the first time in roughly a decade, indicating a shift in sentiment toward higher prices [T1].
- Structural Support: Gold is sitting on long-term support levels. The World Gold Council notes that current prices are broadly in line with a backdrop of moderate growth and cooling but still elevated inflation, setting the stage for a possible breakout [T3].
Relative Positioning vs Bitcoin and Ethereum
Gold and Bitcoin are currently exhibiting divergent behaviors within the same macro narrative. On July 5, both assets rallied following Warsh’s comments, with Bitcoin gaining 2.38% and gold 1.07% as the debasement trade roared back [T8]. However, the broader market context shows a rotation into risk assets, as evidenced by the DAX and S&P 500 outperforming gold. While gold serves as the “hard asset” anchor in the debasement trade, Bitcoin acts as a leveraged risk asset proxy. The current outperformance of DACH equities suggests investors are rotating capital from safe havens into growth, creating a short-term tactical divergence from the long-term structural bullish case for gold.
Scenario Framework
- Base Case: Gold remains rangebound within a +/- 5% band (approx. 3,450–3,800 EUR). SocGen’s central scenario sees 10Y US real yields remaining above 2% through Q3, which caps upside while central bank buying provides support [T5][T3].
- Bull Case: Inflation risks continue to abate, leading to a dovish pivot from the Fed. If real yields decline, gold could reclaim the 4,000 EUR level and target the $5,000–$6,000 range expected by central banks by 2027 [T2][T8].
- Bear Case: Escalation of the Middle East conflict reignites inflation fears, causing real yields to spike. A hawkish surprise from the Fed or a renewed flight to USD safety could see gold test the 3,500 EUR support level [T2][T1].
Valuation Discussion
At 3,638.76 EUR, gold is currently trading at a -22.39% discount to its January 2026 all-time high of 4,688.32 EUR. Despite this pullback, valuation metrics suggest the current level is broadly in line with a global backdrop of moderate growth and elevated inflation. The World Gold Council indicates that under these conditions, gold will likely stay relatively rangebound, with a breakout possible if macro conditions stabilize [T3]. However, SocGen warns that the opportunity cost of holding gold remains elevated, with 10Y US real yields expected to stay above 2% through Q3, which puts a floor on the price but limits immediate upside [T5].
Risks
- Hawkish Fed Stance: The shift to a hawkish Fed under Chair Warsh, characterized by firmer data and expectations of at least one hike before year-end, remains the primary headwind. J.P. Morgan notes that this has turned the structural bullish story into a “deeper freeze” [T1][T7].
- Rising Real Yields: If 10Y US real yields remain stubbornly above 2%, the opportunity cost of holding gold increases, pressuring prices [T5].
- Geopolitical Volatility: While the Middle East conflict is a primary demand driver, its escalation could trigger a renewed flight to safety that favors the USD over gold [T2].
- Risk-On Rotation: The strong performance of DACH equities (DAX +4.68%) signals a risk-on environment that typically leads investors to rotate capital out of defensive assets like gold [Market Overview].
Appendix
Sources
- Gold and silver: From reset to setup heading into Q3 – KITCO [T1]
- Central banks see gold prices trading between $5,000 and $6,000 in 12 months – OMFIF Survey – KITCO [T2]
- These are the key factors that could restart the gold rally this year, or drive prices even lower – World Gold Council H2 Outlook – KITCO [T3]
- Central banks are still betting on gold – KITCO [T4]
- Gold’s biggest buyers aren’t slowing down, but SocGen sees a more measured pace ahead – KITCO [T5]
- For first time, more central banks are set to shrink dollar holdings, survey finds – Reuters [T6]
- Fed turned a ‘pause in the structural bullish gold story’ into ‘a deeper freeze’ – J.P. Morgan’s Shearer – KITCO [T7]
- Warsh’s throwaway comment injects life into the debasement trade, for one day at least – MarketWatch [T8]
This report is AI-generated by GLM 4.7 Flash for informational purposes only and does not constitute investment advice. Past performance is not indicative of future results.
Important Note / Wichtiger Hinweis:
EN: This report may have been generated using AI. It processes data from publicly available sources. The content is provided for informational purposes only.DE: Dieser Bericht kann mithilfe von KI erstellt worden sein. Dabei werden Daten aus öffentlich zugänglichen Quellen verarbeitet. Die Inhalte dienen ausschließlich Informationszwecken.
* DE: Die ergänzenden Inhalte können KI-generiert sein. EN: The additional content may be AI-generated.