
Listen to the summary
Key Data Snapshot
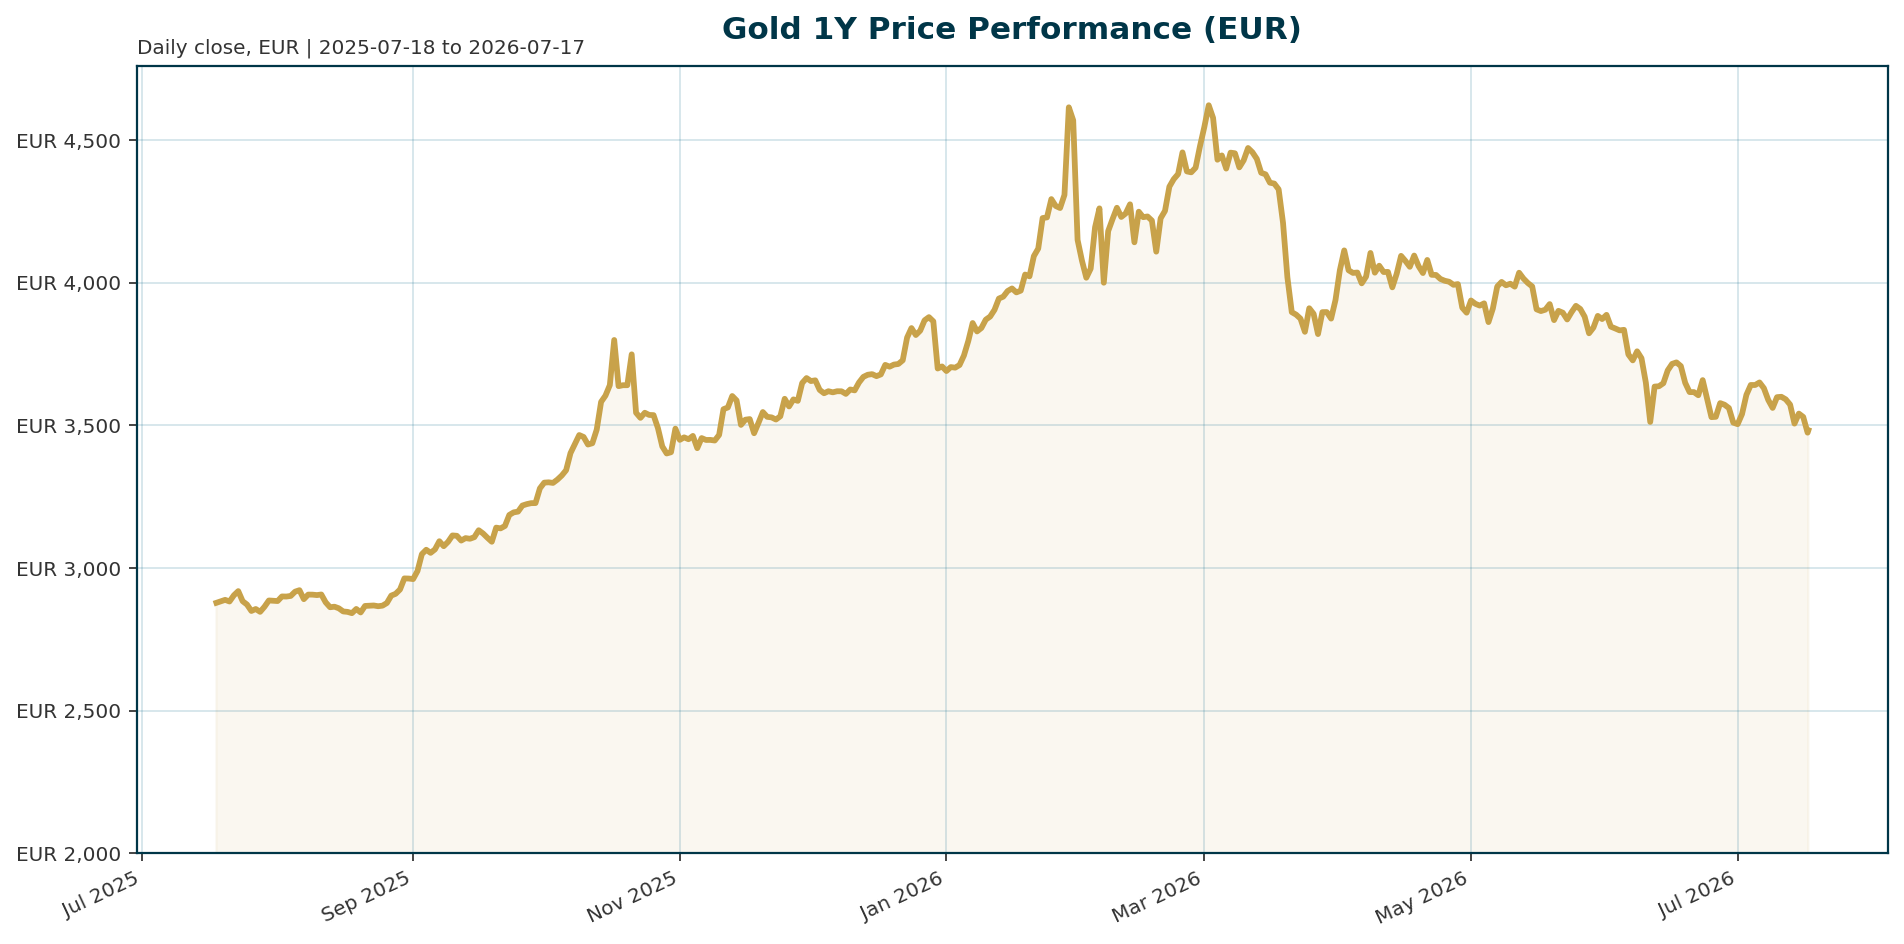
| Metric | Value | Context |
|---|---|---|
| Current Price (XAU/EUR) | 3,483.75 EUR | Trading in a bearish correction zone testing support levels |
| ATH (Jan 2026) | 4,688.32 EUR | Current price is -25.67% below all-time highs |
| 200-Day Change | -9.36% | Consistent downtrend indicating momentum shift |
| Central Bank Net Buys (May) | 41 tonnes | Robust sovereign demand acting as a structural floor |
| ETF Outflows (June) | 2.1m oz | Speculative rotation out of gold into AI/growth sectors |
Macro Backdrop
Risk sentiment is neutral with DACH equities outperforming global peers. The Euro area yield curve is mixed, with the 10Y yield rising to 3.15%. FX markets are mixed, though EUR/USD has strengthened 0.35% over the last five days. Key observations include the Hang Seng leading on a 1-month basis at 0.64% while the Nikkei 225 lags at -5.29%. Gold faces headwinds from rising real yields in the Eurozone, which increase the opportunity cost of holding non-yielding assets. However, geopolitical risks stemming from the global energy crisis and the war with Iran provide a counterbalance to rate-driven selling pressure.Investment Thesis
Gold serves as a critical hedge against USD devaluation and US policy erraticism. With Fed Chair Kevin Warsh signaling that inflation is a “choice” and a function of monetary policy, the central bank is prioritizing a “regime change” to eradicate the inflation tax [T6][T7]. This hawkish stance, combined with erratic US trade and sanctions policies, is driving sovereigns to diversify away from the dollar and into gold [T3]. The asset acts as a store of value in a multipolar world, offering liquidity and counterparty risk mitigation in a fragmented financial system [T2].Bullish Drivers
Central bank accumulation remains the primary bullish structural driver. Poland led buying activity with 18 tonnes in May, extending a streak that has brought its year-to-date purchases to 64 tonnes [T4]. China added 15 tonnes, marking its 20th consecutive month of purchases [T2]. Global surveys indicate a record 45% of central banks plan to increase gold holdings over the next 12 months [T1][T2]. Geopolitical instability, particularly the war with Iran, continues to fuel demand for safe-haven assets, while the hawkish Fed stance reinforces the need for non-dollar reserves [T1][T3].Relative Positioning vs Bitcoin and Ethereum
Speculative capital is currently rotating out of gold into high-growth sectors, evidenced by the largest weekly gold ETF outflows since 2018 [T4][T5]. This rotation suggests that risk appetite is shifting toward AI and growth equities rather than traditional safe havens. While gold remains the dominant store of value, the crypto asset class is likely experiencing divergent flows driven by the AI trade, positioning gold as a more defensive allocation compared to the volatile upside potential of risk-on assets.Scenario Framework
- Base Case (Fed Hold): The Fed maintains a hawkish hold, keeping real yields elevated. Gold consolidates around current levels (3,400–3,500 EUR) as central bank buying offsets speculative selling.
- Bull Case (Fed Pivot): If Warsh signals a pivot to rate cuts or inflation data cools significantly, real yields would compress. This would trigger a re-test of the January 2026 ATH at 4,688.32 EUR.
- Bear Case (Sticky Inflation): If inflation proves stickier than anticipated, real yields could spike further. Gold would likely test the 3,000 EUR mark as the opportunity cost of holding the metal rises.
Valuation Discussion
Gold is currently priced for a “higher for longer” interest rate environment. The discount of 25.67% from the January ATH suggests the market is pricing in significant downside risk or a prolonged consolidation phase. Valuation is attractive if real yields normalize, but expensive if real yields remain elevated due to persistent inflation pressures from the energy crisis [T1].Risks
The primary risk is a sustained rise in real yields. The Euro area 10Y yield is currently at 3.15%, and a further increase would pressure gold prices. Additionally, continued ETF outflows could exacerbate the correction. A sudden strengthening of the USD would also negatively impact XAU/EUR prices, as the dollar remains the primary pricing mechanism for the metal.Appendix
Sources
- Poland’s central bank is buying the dip as gold’s biggest buyers aren’t backing down – KITCO [T1]
- Central banks are voting for gold with their balance sheets – KITCO [T2]
- Fed won’t hike but hold, Warsh may have started too hawkish, and U.S. policy is driving sovereign gold demand – Natixis’ Christopher Hodge – KITCO [T3]
- Gold SWOT: DPM Metals delivers solid Q2 production – KITCO [T4]
- Gold and silver WARNING: The selling is not over – KITCO [T5]
- The Fed is the last independent institutional pillar in the U.S., says Macquarie’s Viktor Shvets – CNBC [T6]
- Fed chair Warsh sidesteps Senate questions on inflation, AI, contact with Trump – Yahoo Finance [T7]
This report is AI-generated for informational purposes only and does not constitute investment advice. Always conduct your own due diligence before making investment decisions.
Important Note / Wichtiger Hinweis:
EN: This report may have been generated using AI. It processes data from publicly available sources. The content is provided for informational purposes only.DE: Dieser Bericht kann mithilfe von KI erstellt worden sein. Dabei werden Daten aus öffentlich zugänglichen Quellen verarbeitet. Die Inhalte dienen ausschließlich Informationszwecken.
* DE: Die ergänzenden Inhalte können KI-generiert sein. EN: The additional content may be AI-generated.