
Listen to the summary
Key Data Snapshot
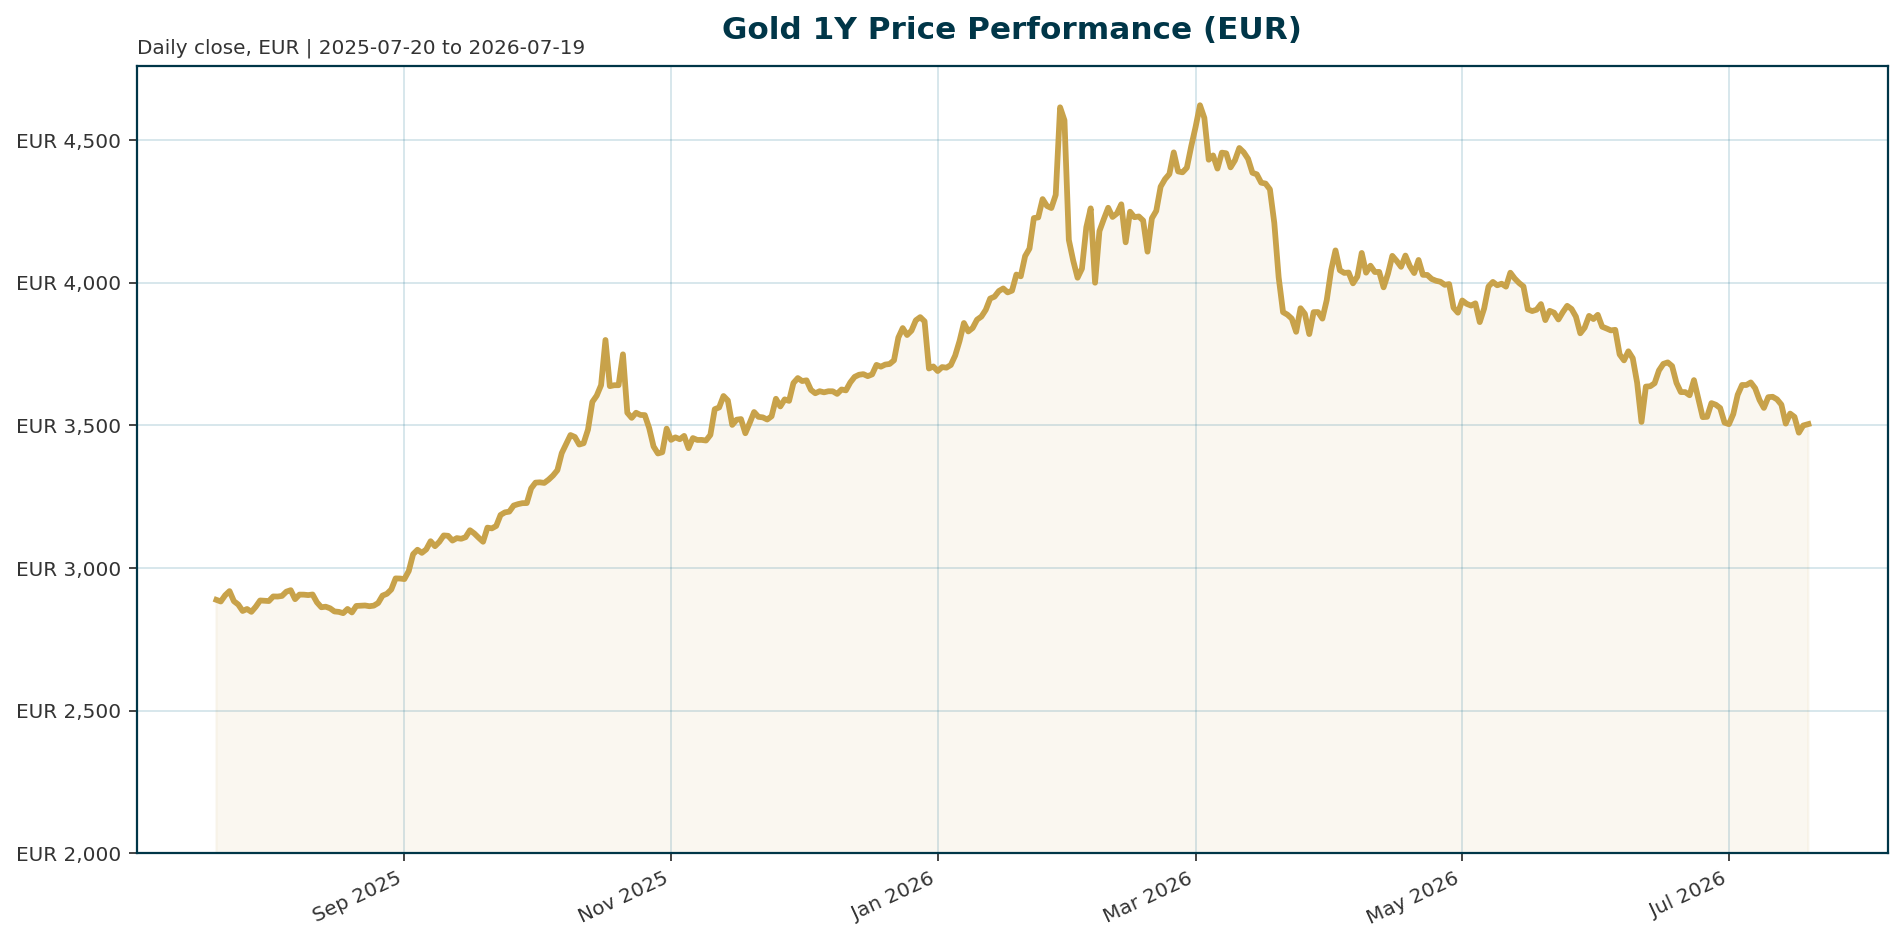
Gold (XAU) trades at 3504.58 EUR, marking a 25.24% drawdown from its January 2026 all-time high of 4688.32 EUR. The current price reflects a consolidation phase following a five-month decline driven by hawkish Fed positioning and renewed geopolitical tensions.
| Metric | Value | Context |
|---|---|---|
| Current Price (XAU/EUR) | 3,504.58 | Consolidating below recent highs |
| 24h Change | +0.06% | Marginal gain after volatility |
| 7d Change | -2.42% | Continuing short-term downtrend |
| 1Y Change | +21.69% | Long-term bullish momentum |
| ATH Drawdown | -25.24% | From Jan 29, 2026 peak |
| Central Bank Net Buys (May) | 41 tonnes | Highest since Nov 2025 [T7] |
| Poland (May) | 18 tonnes | Led global buying [T6] |
| China (May) | 10 tonnes | td>Reserves now 2,331 tonnes [T7]|
| US CPI (YoY) | 3.5% | Above 2% target [T5] |
| Core CPI (YoY) | 2.6% | Down from 2.9% [T5] |
Macro Backdrop
Risk sentiment is neutral to negative with moderately negative equity momentum. The Euro area AAA 10Y yield stands at 3.18% while EUR/USD trades at 1.1457, creating a mixed backdrop for gold. Key observations include the Hang Seng leading on a 5-day basis at 1.44% versus the Nikkei 225 lagging at -4.61%. DACH equity indicators average -1.33% over 5 days, broadly in line with global averages.
Investment Thesis
Gold is evolving from a simple inflation hedge into a critical monetary hedge in a multipolar world. Fed Chair Kevin Warsh faces a difficult balancing act between political demands for easier money and economic data arguing for tighter policy. This environment favors gold as an “outside money” asset that carries no political allegiance or counterparty risk [T1]. The shift in reserve management away from the US dollar, driven by erratic US policymaking, is accelerating central bank accumulation of gold [T2].
Bullish Drivers
- Structural Central Bank Demand: Central bank buying accelerated in May with 41 net tonnes purchased, the highest monthly total since November 2025. Poland led with 18 tonnes and China added 10 tonnes, signaling a strategic pivot away from fiat currencies [T6][T7].
- Geopolitical Risk Premium: Renewed US-Iran hostilities and strikes in the Gulf have disrupted shipping through the Strait of Hormuz, fueling global inflation expectations and safe-haven demand [T4][T6].
- Persistent Inflation: Despite a drop in energy prices, headline CPI remains at 3.5% and core inflation at 2.6%. A prolonged “Fed on hold” environment could contribute to lower real rates, historically a favorable condition for gold [T5].
- Valuation Rotation: The gold mining sector has suffered a “blanket blow” with the Top 50 shedding $228 billion in Q2. This extreme underperformance suggests a potential bottoming in equities and a value rotation back into the metal [T8].
Relative Positioning vs Bitcoin and Ethereum
Gold maintains its status as the primary reserve asset and the “official floor” of the financial system, while Bitcoin (BTC) acts as a high-beta risk asset. With BTC dominance at 56.52% and gold ranking 43rd in market cap, the correlation dynamics are distinct. In the current risk-off environment, gold tends to outperform crypto, whereas crypto rallies are often decoupled from traditional safe-haven flows [T8].
Scenario Framework
- Base Case: The Fed holds rates steady in September with a 50/50 probability. Inflation cools to 2.6%, and gold consolidates between 3,500 and 4,000 EUR.
- Bull Case: Geopolitical tensions in the Gulf escalate, forcing the Fed to remain cautious. Markets price in a rate cut, and gold reclaims its ATH, targeting consensus estimates of 4,700 EUR for 2026/27 [T5].
- Bear Case: The Fed surprises with a hike, and the US dollar strengthens significantly. Indian demand restrictions (tariffs/tax decree) remove 40-70 tons of monthly demand. Gold tests support near 3,000 EUR.
Valuation Discussion
Current prices represent a significant discount to consensus estimates. Despite a 25% drawdown from the January ATH, analysts maintain relatively bullish long-term outlooks, with consensus mean estimates for average annual gold prices standing at around 4,700 EUR for 2026 and 2027 [T5]. The current valuation is supported by structural central bank accumulation rather than speculative leverage, offering a margin of safety for long-term holders.
Risks
- Monetary Policy Tightening: Chair Warsh’s hawkish stance suggests a higher probability of a September rate hike, which would exert immediate downward pressure on gold prices [T2].
- USD Strength: A strengthening dollar, driven by resilient US economic data, makes EUR-denominated gold expensive for foreign buyers and increases the opportunity cost of holding non-yielding assets [T8].
- Demand Shock: The Indian government’s new tariff taxes and decree urging citizens to buy no gold for a year have removed 40-70 tons of monthly demand, creating a near-term supply glut [T3].
- Geopolitical De-escalation: A sudden resolution to the US-Iran conflict or Strait of Hormuz blockade would remove the primary safe-haven premium supporting the metal [T4].
Appendix
Sources
- Gold is becoming the reserve asset of the new multipolar world – Sprott’s Paul Wong – Shanghai Metals Market [T1]
- Fed won’t hike but hold, Warsh may have started too hawkish, and U.S. policy is driving sovereign gold demand – Natixis’ Christopher Hodge – KITCO [T2]
- Gold bugs versus mainstream narrators – KITCO [T3]
- Wall Street breaks bearish, Main Street sentiment still split after gold struggles to maintain $4,000 support amid summer doldrums – KITCO [T4]
- VanEck’s Casanova sees gold’s pullback as noise, says mining stocks remain the standout trade – KITCO [T5]
- Precious metals prices slide amid renewed Gulf strikes, Perth Mint silver bar and coin demand collapses – Heraeus – KITCO [T6]
- Gold SWOT: DPM Metals delivers solid Q2 production – KITCO [T7]
- Rate-Hike Fears and Gold’s Retreat: Mining Top 50 Shed $228 Billion in Q2 – NAI500 [T8]
This report is AI-generated for informational purposes only and does not constitute investment advice. All data is provided as of the date of generation.
Important Note / Wichtiger Hinweis:
EN: This report may have been generated using AI. It processes data from publicly available sources. The content is provided for informational purposes only.DE: Dieser Bericht kann mithilfe von KI erstellt worden sein. Dabei werden Daten aus öffentlich zugänglichen Quellen verarbeitet. Die Inhalte dienen ausschließlich Informationszwecken.
* DE: Die ergänzenden Inhalte können KI-generiert sein. EN: The additional content may be AI-generated.