
Watch the video
This player shows only the Gold chapter of the daily altii market briefing. Watch the full video on tube.altii.de.
Key Data Snapshot
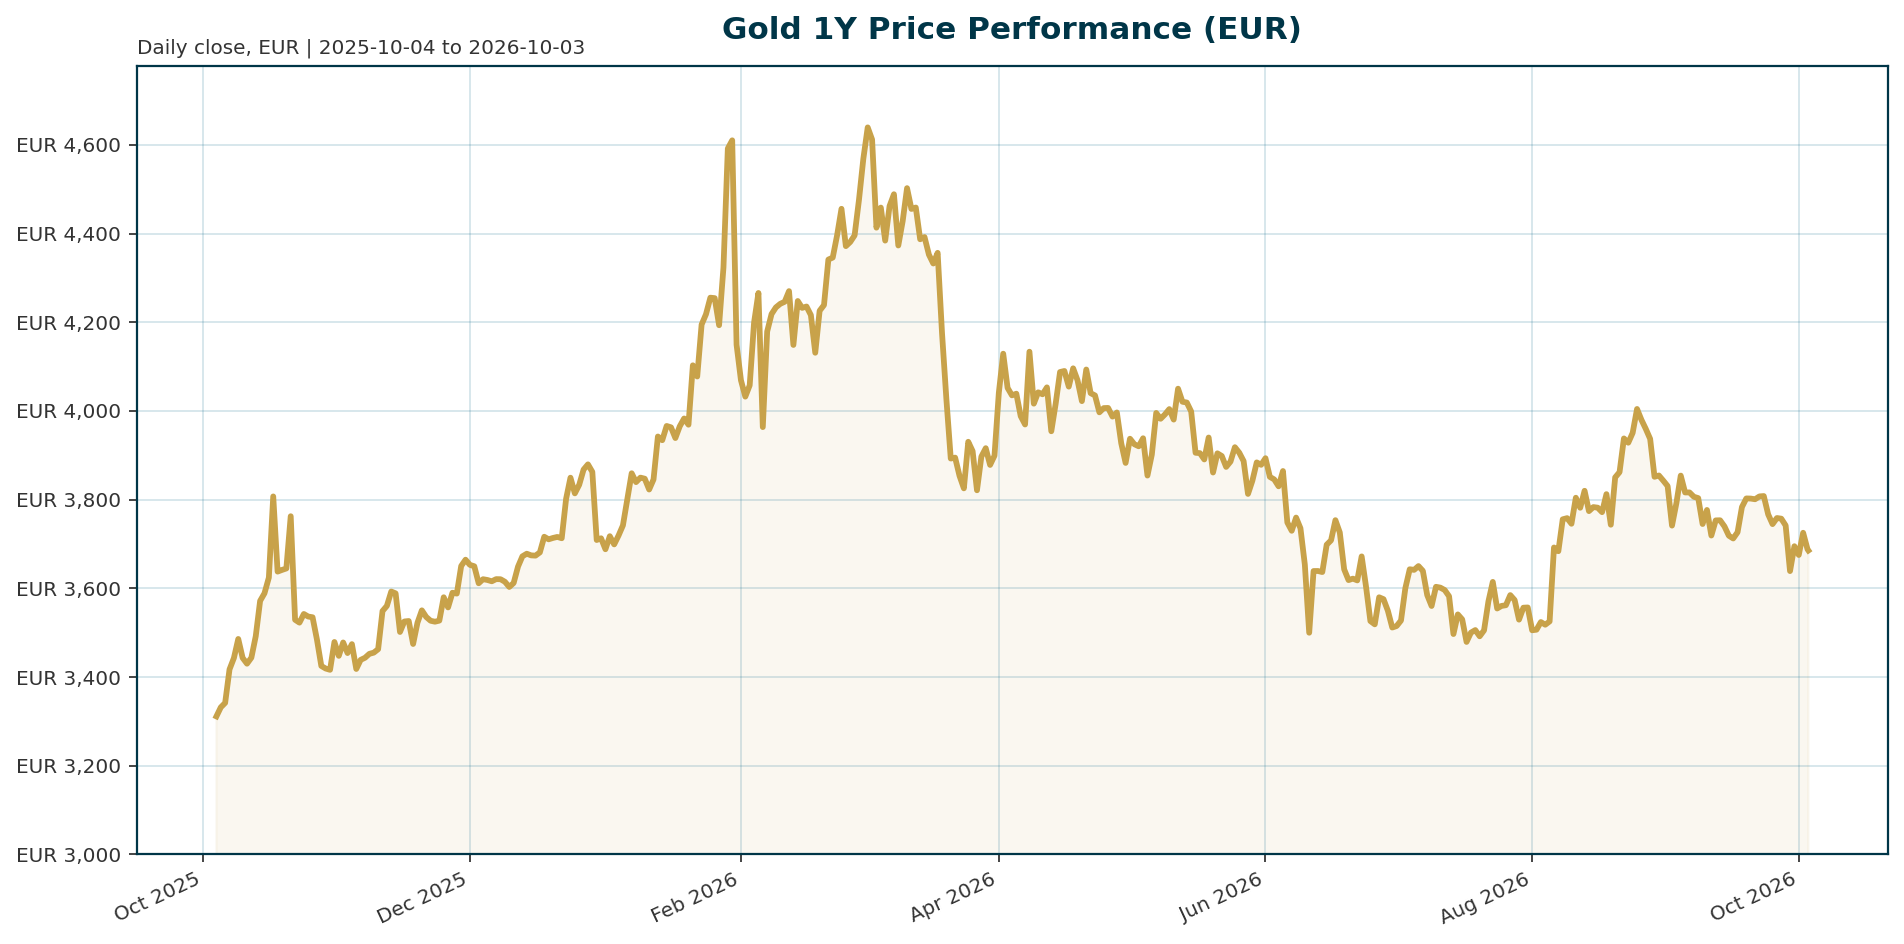
The altii-Gold-Report covers gold (XAU) quoted in euro. All price and performance data below refer to the tracked gold instrument in the report bundle, retrieved 2026-10-03 at 04:33:56 UTC. The market capitalization, supply, and volume figures describe the tracked tokenized gold proxy, not the global physical gold market.
| Metric | Value | Note |
|---|---|---|
| Price (EUR) | 3,686.61 | Spot, EUR quote |
| Change 1h / 24h | +0.01% / -1.12% | Short-term drift lower |
| Change 7d / 14d | -3.09% / -4.93% | Tactical weakness |
| Change 30d / 200d | -6.22% / -17.10% | Multi-month drawdown |
| Change 1y | +7.59% | Longer-term trend still positive |
| 24h high / low | 3,750.68 / 3,674.29 | Range 76.39 EUR, about 2.07% of spot |
| All-time high | 4,688.32 (2026-01-28) | Spot is 21.37% below; upside to ATH is 27.17%: (4,688.32 / 3,686.61 – 1) x 100 |
| All-time low | 1,265.28 (2019-11-17) | Spot is 2.91x the ATL (reported +191.37%) |
| Market cap (proxy) | 1,603,945,502 EUR | Instrument-level, rank 57 |
| 24h volume (proxy) | 171,455,706 EUR | About 10.69% of proxy market cap |
| Supply (proxy) | 435,070.59 | Circulating equals total; no max supply |
| BTC dominance | 58.73% | Crypto context, bundle-reported |
Calculation notes: 24h range = 3,750.68 minus 3,674.29 = 76.39 EUR, or 76.39 / 3,686.61 = 2.07% of spot. Volume-to-market-cap = 171,455,706 / 1,603,945,502 = 10.69%. Drawdown reconciliation = (3,686.61 / 4,688.32 – 1) x 100 = -21.37%.
Macro Backdrop
Cross-asset context: Risk sentiment is neutral and equity momentum is mixed. DACH indicators average -2.38% over five days versus +0.85% for global equity indicators, so the DACH region is lagging. The rates backdrop shows mixed euro yields, and the euro is broadly weaker: EUR/USD sits at 1.1294, down 0.63% over five days, with an average five-day move of roughly -0.53% across EUR/USD, EUR/CHF, EUR/JPY, and EUR/GBP. Nikkei 225 leads five-day equity performance at +3.69% while ATX is weakest at -4.19%. These observations are context only; the gold analysis below drives the report.
Rates and inflation: Euro-area AAA yields are split. The 2Y yield is 3.106%, down 14.46 bp over five days but up 23.05 bp over one month, while the 30Y yield is 3.835%, up 4.75 bp over five days. The 30Y-2Y slope is about +72.85 bp, and the five-day curve move is roughly +19.21 bp of steepening. Globally, the picture is hawkish: renewed oil strength has lifted inflation pressure, rate-hike expectations, and Treasury yields, and the ECB and Bank of Japan already raised rates in 2026, reversing the 2025 easing cycle [T7]. Markets expect additional Fed rate hikes through mid-2027 [T7]. State Street argues the Fed path matters tactically, but the longer-term challenge extends to fiscal pressures, sovereign issuance, and rising risk premia on government debt rather than pure growth optimism [T3].
Reserve regime: Goldman Sachs notes gold trades with real rates day to day, but the longer-term relationship broke down after 2022 when the Russia-Ukraine conflict and the confiscation of Russian central-bank reserves triggered sustained physical gold accumulation, mainly by emerging-market central banks [T8]. The IMF cautions that gold’s rising share in reserves partly reflects valuation gains rather than large-scale new purchases [T5]. An academic proposal to back currencies with real, inflation-protected assets underscores how central-bank reserve composition is back in active debate [T2].
Investment Thesis
The strategic case for gold rests on demand that does not depend on real yields. Central-bank purchases have exceeded 1,000 tons annually over the past three years, 95% of surveyed central banks expect to increase holdings, and 90% hold gold for its crisis performance while 84% value it as an inflation hedge [T1][T6]. Post-2022 reserve-security concerns have made this a durable flow, and Goldman Sachs identifies central-bank accumulation as the one flow that has remained intact while other positioning was cut heavily [T8]. Fiscal and inflationary pressure on G10 sovereigns adds a second structural pillar, because higher long-end yields may embed risk premia on government debt rather than a stronger growth outlook [T3].
The tactical case is currently negative. Gold in EUR is down across the 24h, 7d, 14d, 30d, and 200d horizons, including -17.10% over 200 days, and sits 21.37% below its January 2026 high. With the ECB and other major central banks tightening in 2026 [T7], the opportunity cost of a non-yielding asset rises, and price-sensitive private investors, who State Street identifies as the growing marginal bid [T3], can reduce exposure. The balanced view: gold is a strategic diversifier in a drawdown phase, attractive for accumulation on a 12-month horizon, but lacking confirmed near-term momentum. A weaker euro can cushion EUR-denominated returns only if the USD gold price does not fall by more than the FX effect.
Bullish Drivers
- Central-bank demand: Over 1,000 tons of annual purchases for three years, with 95% of central banks expecting to buy more and 44% now actively managing gold reserves, the highest since the survey began in 2018 [T1].
- Reserve-security regime: Sustained emerging-market accumulation since the 2022 Russian reserve confiscation [T8], a flow largely insensitive to yields.
- Inflation-hedge demand: 84% of central banks value gold as an inflation hedge and store of value [T6]; renewed oil-driven inflation pressure supports this motive [T7].
- Rate-cut sensitivity: If tightening expectations fade, lower real yields and a softer dollar historically boost gold [T4][T1].
- Fiscal risk premia: If long-end yields reflect sovereign risk rather than growth, gold competes better against bonds as a reserve asset [T3].
- Euro weakness: EUR/USD down 2.65% over one month and broadly softer crosses can lift EUR-denominated gold even with a flat USD gold price.
- Price entry: A 21.37% drawdown from the ATH offers a lower entry point for strategic buyers, with 27.17% upside to the prior peak.
Relative Positioning vs Bitcoin and Ethereum
The bundle does not provide Bitcoin or Ethereum price or return series, so a quantified comparison is unavailable. Available context: BTC dominance is 58.73% and the bundle-reported total crypto market capitalization is about 2.56 trillion with 101.8 billion in 24h volume. The asset configuration lists ethereum as a benchmark asset.
Qualitatively, gold and digital scarcity assets compete for similar portfolio roles but differ in demand structure. Gold has institutional reserve demand: central banks hold it for crisis performance and diversification [T6][T8], and it has gained ground on Treasuries in foreign official reserves [T3]. Bitcoin and Ethereum lack this official-sector bid in the supplied facts; they depend on private risk appetite and crypto-market liquidity. In a reserve-risk or sanctions-risk regime, gold should hold an advantage. If risk appetite improves and crypto liquidity broadens, Bitcoin and Ethereum can outperform, but the bundle contains no data to evidence or size that claim. A USD-stablecoin or tokenized-gold comparison is also limited: the tracked proxy has a 1.6 billion EUR market cap, negligible against aggregate crypto capitalization.
Scenario Framework
- Base (probability: moderate): Gold stabilizes near current levels as euro weakness and continued reserve demand offset elevated rate uncertainty. EUR price range roughly 3,650 to 3,800, defined by the recent 24h low of 3,674.29 and high of 3,750.68 widened for volatility.
- Bull: Tightening expectations fade, front-end yields extend their five-day decline (-14.46 bp), real yields fall, and the euro stays soft. Gold reclaims 4,000 and moves toward the 4,688.32 ATH zone, a 27.17% move from spot.
- Bear: Oil-driven inflation forces further ECB and Fed tightening [T7], real yields rise for growth-positive reasons, and private investors keep reducing exposure [T8]. Gold breaks below 3,600 and the 200-day downtrend extends.
- Stress: A geopolitical or reserve-security shock revives safe-haven demand. Gold becomes insensitive to real yields in the short run, as observed after 2022 [T8], and can rally sharply regardless of rates.
- Disinflation: Inflation pressure fades without a fiscal or geopolitical shock. Gold needs explicit rate-cut expectations to regain upside; without them, its zero yield is a persistent headwind [T1].
Valuation Discussion
Gold has no cash flow, so valuation rests on opportunity cost and relative scarcity. The primary anchor is real yields: gold competes with bonds for reserve and defensive capital, and rate moves transmit directly to its attractiveness [T1][T8]. The secondary anchor is the regime question. If higher long-end yields increasingly embed fiscal and inflation risk premia on sovereign debt rather than stronger growth [T3], the negative correlation between gold and yields weakens, and gold can be valued more like a monetary reserve asset than a rate-sensitive commodity. The historical precedent is direct: under gold-standard and reserve-backed systems, central-bank gold holdings anchored currency credibility [T2].
Position within the historical range: spot at 3,686.61 sits 2.91x the 2019 all-time low and 21.37% below the January 2026 high. Valuation is therefore neither at capitulation nor at extremes. For EUR investors, valuation must separate the gold-price effect from FX translation: with EUR/USD down 2.65% over one month, part of any EUR gold recovery could come from the currency rather than the metal. No USD gold price, DXY, or US real-yield series is supplied, so USD-side valuation precision is unavailable. On valuation grounds, gold looks reasonably placed for strategic accumulation after a 17.10% two-hundred-day decline, but not yet cheap enough to signal a confirmed trend reversal.
Risks
- Higher real yields: Rising rates lift yields on bonds and equities and reduce the appeal of a non-yielding asset [T1]. Oil-driven inflation and rate-hike expectations through mid-2027 [T7] are the live catalyst.
- Overstated central-bank demand: The IMF warns gold’s reserve prominence partly reflects valuation gains rather than large-scale purchases [T5]. If true, the structural demand pillar is weaker than headlines suggest.
- Positioning unwind: Heavy de-risking across the Goldman franchise leaves central-bank accumulation as the main remaining flow [T8]; if that flow slows, downside can accelerate.
- FX risk: A stronger euro would reduce EUR-denominated returns even with stable USD gold. EUR/USD at 1.1294 could rebound from oversold levels.
- Proxy and data limitations: Market cap, supply, and volume describe the tokenized gold proxy, not the physical market. Euro-area 5Y and 10Y yield retrieval failed (the 10Y request returned HTTP 504), so curve analysis relies on 2Y and 30Y tenors only. No USD gold price, real-yield, breakeven, or ETF flow data is supplied. Tavily publication dates are null, so source recency cannot be validated.
- Trend risk: Negative returns across all horizons from 24h to 200d mean the burden of proof is on the bulls until momentum stabilizes.
Appendix
Data provenance: Bundle generated 2026-10-03 at 04:35:04 UTC. Market data retrieved 2026-10-03 at 04:33:56 UTC; market overview series carry as-of dates of 2026-10-01 (ECB yields), 2026-10-02 (equities), and 2026-10-03 (FX). Because timestamps differ across series, intraday causal claims should be treated cautiously. Tavily publication dates are null for all sources.
Missing data explicitly flagged: USD gold price, DXY, US real yields, inflation breakevens, gold ETF flows, euro-area 5Y and 10Y yields, and Bitcoin and Ethereum price and return series are unavailable. Where the report references these, it states so explicitly rather than inferring values.
Key calculations shown: 24h range = 3,750.68 – 3,674.29 = 76.39 EUR (2.07% of spot). Upside to ATH = (4,688.32 / 3,686.61 – 1) x 100 = 27.17%. ATL multiple = 3,686.61 / 1,265.28 = 2.91x. Volume/market cap = 10.69%. 30Y-2Y slope = 3.8350% – 3.1065% = 72.85 bp. Five-day curve change = +4.75 bp minus -14.46 bp = +19.21 bp steepening. Average five-day EUR cross move = (-0.63 – 0.74 – 0.28 – 0.47) / 4 = approximately -0.53%.
Source quality note: Social-media and secondary summaries (T4, T6, and the LinkedIn item T5) are used only as corroborating support for claims also grounded in higher-quality sources. Garbled portions of T1 were not used.
Sources
- [T1] Geopolitical Determinants of Global Gold Demand: futureuae.com
- [T2] An Inflation-Protected Balance Sheet, John H. Cochrane: grumpy-economist.com
- [T3] Fed Tightening Should Not Alter Gold’s Structural Story, State Street: ssga.com
- [T4] Gold and US Government Bonds Relationship: facebook.com
- [T5] Gold Reserves Carry High Risk, IMF Warns Central Banks: linkedin.com
- [T6] Central Banks Prioritizing Gold: facebook.com
- [T7] Federal Reserve Monetary Policy, U.S. Bank: usbank.com
- [T8] Why Gold Is Expected to Rise to Record Highs, Goldman Sachs: goldmansachs.com
Disclaimer: This report is AI-generated and for informational purposes only. It does not constitute investment advice, a recommendation, or an offer to buy or sell any financial instrument. Investors should conduct their own analysis and consult a licensed advisor before making investment decisions. Past performance does not guarantee future results.
Important Note / Wichtiger Hinweis:
EN: This report may have been generated using AI. It processes data from publicly available sources. The content is provided for informational purposes only.DE: Dieser Bericht kann mithilfe von KI erstellt worden sein. Dabei werden Daten aus öffentlich zugänglichen Quellen verarbeitet. Die Inhalte dienen ausschließlich Informationszwecken.
* DE: Die ergänzenden Inhalte können KI-generiert sein. EN: The additional content may be AI-generated.