
Watch the video
This player shows only the Gold chapter of the daily altii market briefing. Watch the full video on tube.altii.de.
Key Data Snapshot
| Metric | Latest | Interpretation |
|---|---|---|
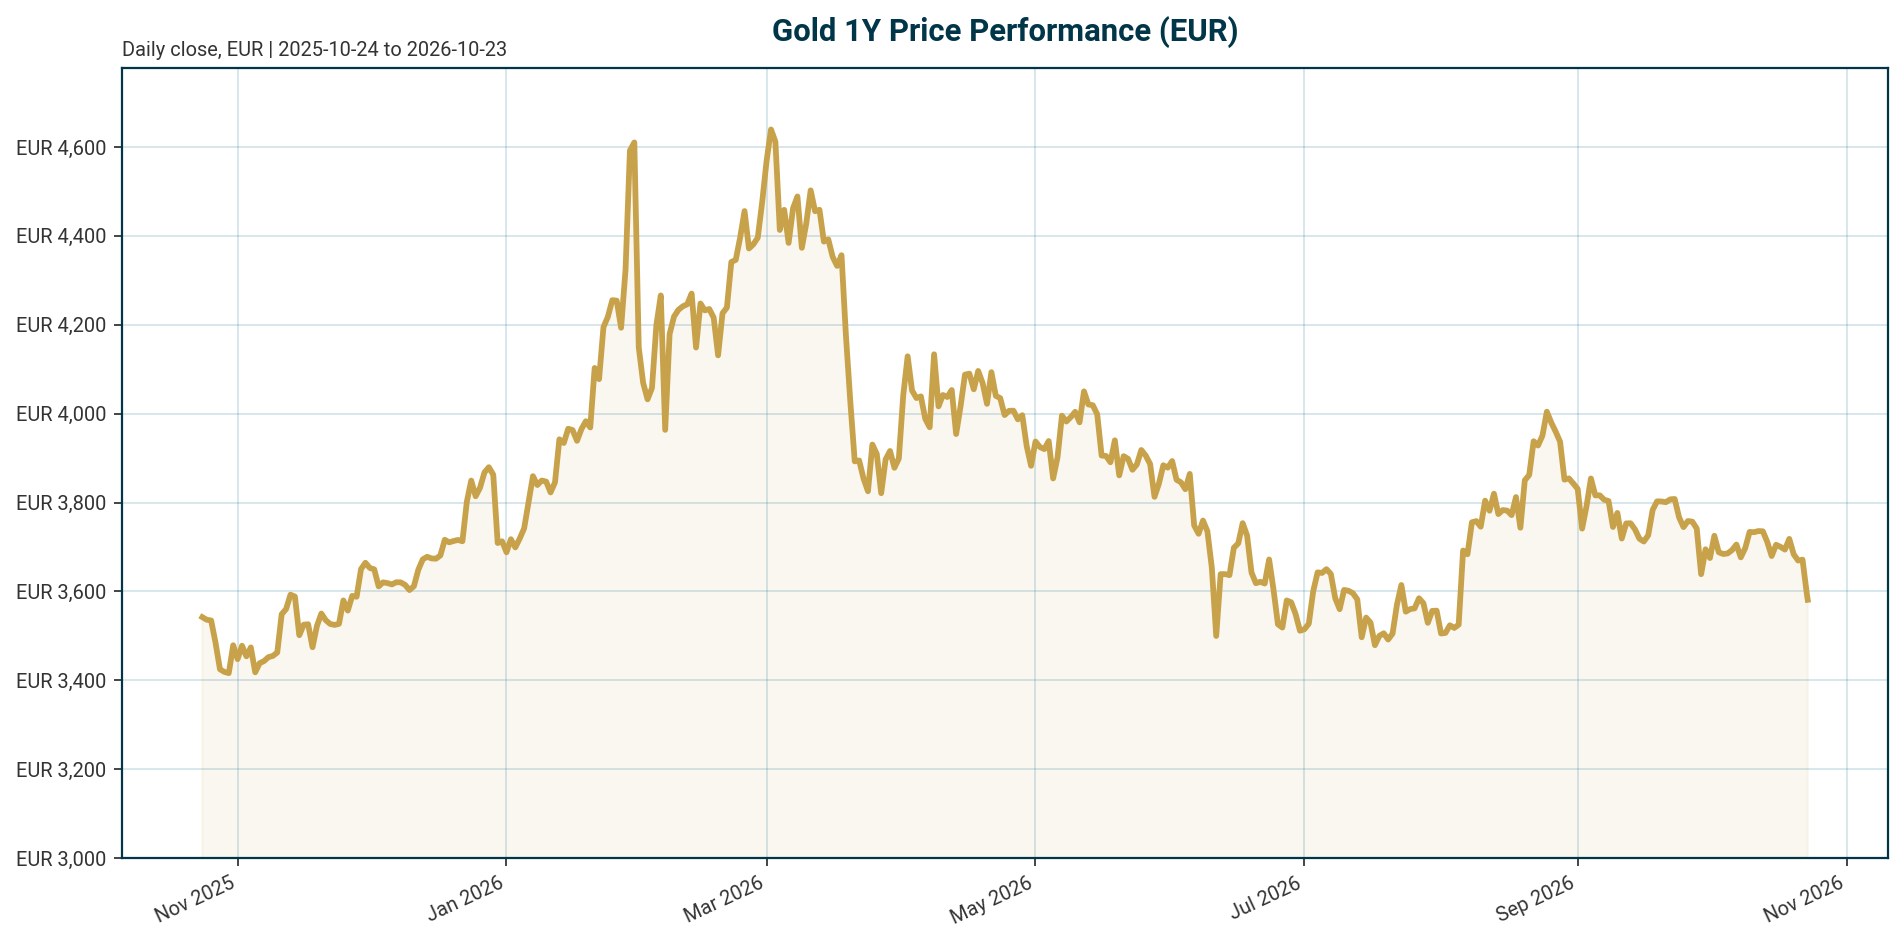
| XAU/EUR spot | €3,582.87 | Gold is in a correction phase in EUR terms. |
| Performance | 1h: -0.0413%; 24h: -1.6218%; 7d: -3.5025%; 30d: -7.0297%; 200d: -13.0697%; 1y: -1.5375% | Momentum is negative across most time horizons, with the one-year decline still modest. |
| 24h range | Low: €3,567.04; high: €3,662.71 | Range: €95.67, equal to 2.67% of spot. Calculation: 3,662.71 – 3,567.04 = 95.67; 95.67 / 3,582.87 = 2.67%. |
| Distance from all-time high | ATH: €4,688.32 on 2026-01-28; current: -23.5788% | Absolute gap: €1,105.45. Calculation: 4,688.32 – 3,582.87 = 1,105.45. |
| Distance from all-time low | ATL: €1,265.28 on 2019-11-17; current: +183.1670% | Absolute gain: €2,317.59. Calculation: 3,582.87 – 1,265.28 = 2,317.59. |
| Implied XAU/USD | $4,026.07 | Calculation using provided EUR/USD: 3,582.87 × 1.1237 = 4,026.07. This is an implied conversion, not an independent USD spot quote. |
| EUR/USD | 1.1237 | 5d: +0.0356%; 1m: -1.7745%; YTD: -4.3660%. EUR weakness can support XAU/EUR even when USD gold is flat. |
| Euro area AAA yields | 2Y: 3.0282%; 5Y: 3.1598%; 10Y: 3.4292%; 30Y: 3.6785% | 10Y-2Y spread: 40.10 bp. Calculation: 3.4292% – 3.0282% = 0.4010%. |
| Instrument liquidity proxy | Market cap: €1.586bn; 24h volume: €168.654mn; rank: 55 | Turnover proxy: 10.64%. Calculation: 168.654mn / 1,585.618mn = 10.64%. These are tokenized-gold instrument metrics, not the global physical gold market. |
| Supply metric | Circulating supply: 442,473.325507; total supply: 442,468.840480; max supply: unavailable | Use as instrument context only. |
Macro Backdrop
Cross-asset conditions are defensive but not cleanly bullish for gold. The market overview shows negative risk sentiment, broadly negative equity momentum, mixed euro-yield signals and mixed FX. Hang Seng is the weakest 5-day performer at -4.71%, while the S&P 500 is the strongest at +0.05%. DACH indicators average -2.73% over five days versus -2.29% for global equity indicators. Euro area AAA 10Y yield is 3.43%, up 3.9 bp over five days, with a 10Y-2Y spread of 40.1 bp. EUR/USD is 1.1237, almost flat over five days at +0.04%.
For gold, the macro signal remains two-sided. On the bullish side, weak risk appetite and concerns about purchasing power can lift demand for monetary hedges. On the bearish side, nominal euro yields remain elevated, and the bundle does not provide real-yield data, inflation breakevens or ETF flows. That data gap matters because gold does not pay income, so real yields are a core opportunity-cost variable [T7].
The traditional inverse relationship between gold and real yields appears less stable than in previous cycles. Market participants have argued that gold’s negative correlation with bond yields is weakening as debt burdens, persistent inflation and fiat purchasing-power concerns raise strategic allocations [T1]. J.P. Morgan also notes that gold stayed resilient in 2022 and 2023 even as real yields rose sharply from deeply negative levels to the highest levels since the global financial crisis [T4]. This supports the view that reserve diversification and monetary credibility concerns now offset part of the rates headwind, but they do not eliminate it.
Investment Thesis
Gold in EUR combines a weak tactical tape with a still-credible structural allocation case. XAU/EUR is down 7.0297% over 30 days and 13.0697% over 200 days, which argues against chasing short-term momentum. Yet the reserve-demand framework remains supportive: Societe Generale identifies central bank buying and real yields as the two primary forces shaping gold, with official-sector purchases providing a structural backstop as reserve managers diversify away from the US dollar [T2].
The strongest medium-term argument is not that gold is cheap after a 23.58% drawdown from its January 2026 high. It is that strategic demand may have shifted upward. The World Gold Council reports that central banks accumulated an average of 1,000 tonnes of gold over the past four years, double the 500-tonne average over the preceding decade [T6]. Calculation: 1,000 / 500 = 2.0x, or a 100% increase. In the same survey, 89% of respondents expect global central bank gold reserves to rise over the next 12 months, while a record 45% expect their own reserves to increase and only 1% expect a decrease [T6]. The simple net balance for own-reserve expectations is therefore +44 percentage points.
The thesis for EUR-based investors is balanced: maintain gold as a strategic hedge and liquidity diversifier, but recognize that the current price path still reflects rate sensitivity, positioning risk and possible private-investor fatigue. A stronger bull phase likely requires at least one of three conditions: falling real yields, renewed inflation or geopolitical hedging demand, or further EUR weakness versus USD.
Bullish Drivers
- Official-sector demand: Central banks have averaged 1,000 tonnes of annual accumulation over the past four years, compared with 500 tonnes over the preceding decade [T6]. This is the clearest structural support in the current framework.
- Reserve diversification: Emerging-market and geopolitically exposed institutions continue to treat gold as a reserve asset not tied to one currency, issuer or sanctions regime [T2]. J.P. Morgan notes that some countries not aligned with the United States are reducing dollar concentration to make reserves less vulnerable to sanctions [T4].
- Crisis hedge demand: The WGC survey cited in Mexico Business News had 76 responses, the highest participation since the survey began nine years ago. It also reports that 90% of respondents viewed gold’s historical crisis performance as highly relevant, while 95% of EMDE institutions viewed geopolitical instability as a key allocation driver versus 67% of advanced-economy institutions [T3].
- Inflation and monetary credibility: Gold can benefit when investors question the purchasing power of fiat currency or the credibility of fiscal and monetary frameworks. Lombard Odier argues that resilient demand, fiscal uncertainty and purchasing-power erosion support real assets, while recent headwinds look more short term than structural [T5].
- Operational reserve behavior: The Dutch Central Bank reportedly moved about 86 tonnes of gold from the United States and Canada to London between March and August 2026, citing crisis preparedness and London’s role as a physical trading hub [T1]. This does not itself create net demand, but it signals that reserve managers are actively reviewing access, storage and mobilization.
- FX translation for EUR investors: EUR/USD is down 1.7745% over one month and 4.3660% YTD. If EUR weakens further, XAU/EUR can outperform USD gold through translation effects.
Relative Positioning vs Bitcoin and Ethereum
Gold, Bitcoin and Ethereum all sit in the broader scarcity and alternative-store-of-value discussion, but they play different institutional roles. Gold benefits from central-bank ownership, deep physical-market history and reserve-asset status. Bitcoin offers digital scarcity and high sensitivity to liquidity and adoption cycles. Ethereum adds smart-contract exposure and network-beta characteristics, but it is less directly comparable to gold as a pure reserve asset.
The available crypto data are limited. BTC dominance is 59.4560%, total crypto market capitalization is €2.456tn and total crypto 24h volume is €68.672bn. Direct BTC/EUR, BTC/USD, ETH/EUR and ETH/USD prices and returns are unavailable in the bundle, so no quantitative relative-performance conclusion can be drawn.
Scenario framing is therefore qualitative. In a risk-off environment, gold may outperform Bitcoin and Ethereum if defensive reserve demand dominates speculative liquidity. In a liquidity-driven risk rally, Bitcoin and Ethereum may outperform gold if falling real yields coincide with stronger risk appetite. If fiat-debasement narratives dominate while risk sentiment remains fragile, gold and Bitcoin can both benefit, while Ethereum’s relative performance would require separate network-activity, staking, fee and risk-beta data not provided here.
Scenario Framework
| Scenario | Macro Conditions | XAU/EUR Implication | Key Watchpoints |
|---|---|---|---|
| Base case: consolidation | Risk sentiment remains negative, euro yields stay elevated but not sharply higher, central-bank demand remains firm. | Gold stabilizes after the 30-day decline of 7.0297% and 200-day decline of 13.0697%, but upside remains capped by opportunity-cost pressure. | Euro real yields, EUR/USD, ETF flows, physical demand and central-bank survey follow-through. |
| Bull case: reserve-demand repricing | Real yields fall, inflation or geopolitical hedging demand persists, and official-sector buying remains near recent high levels. | XAU/EUR retests higher ranges, helped further if EUR weakens against USD. | WGC reserve data, policy-rate expectations, inflation surprises and safe-haven flows. |
| Bear case: real-yield shock | Policy stays restrictive, real yields rise quickly, ETF or private-investor demand weakens and physical demand softens. | XAU/EUR remains under pressure despite central-bank buying. Lombard Odier flags higher-for-longer real yields, prolonged ETF-demand decline and lower physical demand such as jewellery as risks [T5]. | Real yields, ETF redemptions, jewellery demand, EUR strength and positioning. |
| Tail bull: monetary credibility shock | A fiscal, geopolitical or currency shock forces investors to reprice gold as a reserve asset despite high nominal yields. | Gold’s correlation with yields weakens further, consistent with the “re-anchoring” argument reported by market participants [T1]. | Sovereign stress, central-bank reserve behavior, USD liquidity and vaulting flows. |
Valuation Discussion
Gold valuation should be framed as a regime assessment, not a single-point fair value. At €3,582.87, XAU/EUR trades 23.58% below its €4,688.32 all-time high but 183.17% above its €1,265.28 all-time low. The current level therefore sits below the 2026 peak but still far above the post-2019 reference point. That combination supports neither a simple “cheap” conclusion nor a simple “bubble” conclusion.
The implied USD price is $4,026.07, based only on the provided EUR/USD rate. Calculation: €3,582.87 × 1.1237 = $4,026.07. This matters because many global gold narratives, including real-yield and reserve-diversification debates, are expressed in USD terms, while EUR investors experience both gold-price movement and currency translation.
The opportunity-cost channel remains material. Euro area AAA 10Y yield is 3.4292% and 2Y yield is 3.0282%, while gold pays no coupon, dividend or interest. When real yields rise, income-generating assets become more competitive [T7]. However, the structural premium may be higher than in prior cycles if reserve diversification, geopolitical hedging and currency-debasement concerns have raised strategic allocations. The reported weakening of gold’s negative correlation with yields and gold’s resilience during earlier real-yield increases support that possibility [T1][T4].
A practical valuation stance is therefore conditional. Gold looks tactically vulnerable if real yields rise and private flows fade. It looks strategically supported if central-bank demand remains near recent averages and investors continue to pay a premium for monetary insurance. The current 30-day and 200-day price declines show that the structural bid has not prevented drawdowns.
Risks
- Real-yield risk: A rapid rise in real yields would raise the opportunity cost of holding gold. Societe Generale warns that a sharp monetary-policy reversal leading to higher real yields could be a headwind [T2]. UBS also states that gold has been under pressure mainly because real yields have risen rapidly [T8].
- Higher-for-longer policy: If restrictive policy persists while inflation expectations fall, real yields could remain unfavorable for gold.
- Flow risk: Prolonged ETF-demand weakness or lower jewellery demand could offset part of the official-sector bid [T5]. ETF flow data and jewellery-demand data are unavailable in the bundle.
- FX risk for EUR investors: EUR/USD has declined 1.7745% over one month and 4.3660% YTD. A material EUR rebound would reduce XAU/EUR returns relative to USD gold.
- Momentum risk: XAU/EUR is already down 7.0297% over 30 days and 13.0697% over 200 days. Negative price momentum can trigger further de-risking even when the strategic narrative remains intact.
- Central-bank narrative risk: The bull case depends heavily on continued reserve accumulation. If official-sector buying slows materially from survey expectations, the structural premium could compress.
- Data limitation risk: Real yields, inflation expectations, ETF flows, futures positioning, jewellery demand, mine supply and direct BTC/ETH return series are unavailable in the provided bundle.
Appendix
Selected Calculations
- Implied XAU/USD: 3,582.87 × 1.1237 = 4,026.07.
- Distance to ATH: 4,688.32 – 3,582.87 = 1,105.45. Percentage drawdown: 1,105.45 / 4,688.32 = 23.58%.
- Distance from ATL: 3,582.87 – 1,265.28 = 2,317.59. Percentage gain: 2,317.59 / 1,265.28 = 183.17%.
- 24h range: 3,662.71 – 3,567.04 = 95.67. Range as percent of spot: 95.67 / 3,582.87 = 2.67%.
- 10Y-2Y euro AAA spread: 3.4291547786% – 3.0281868841% = 0.4009678945%, or 40.10 bp.
- 30Y-2Y euro AAA spread: 3.6785494623% – 3.0281868841% = 0.6503625782%, or 65.04 bp.
- 10Y-5Y euro AAA spread: 3.4291547786% – 3.1597954504% = 0.2693593282%, or 26.94 bp.
- 30Y-10Y euro AAA spread: 3.6785494623% – 3.4291547786% = 0.2493946837%, or 24.94 bp.
- Central-bank accumulation acceleration: 1,000 tonnes / 500 tonnes = 2.0x, or +100%.
- Own-reserve survey balance: 45% expecting an increase – 1% expecting a decrease = +44 percentage points.
- Tokenized-gold turnover proxy: 168,654,088 / 1,585,618,307 = 10.64%.
Data Notes
Report generated at 2026-10-23T04:20:42.562776Z. Asset: Gold, symbol XAU, quote currency EUR, report profile gold_macro. Market data use the coingecko_id “pax-gold”; therefore market cap, supply and volume should be read as tokenized-gold instrument metrics, not as the total global physical gold market. The market overview reports no errors. Direct data for real yields, inflation expectations, ETF flows, jewellery demand, mine supply, futures positioning and BTC/ETH returns are unavailable.
Sources
- [T1] Gold Holds Above $4,000 Even as US Treasury Yields Top 5% — Institutions Say Gold’s Pricing Logic Is “Re-Anchoring” — BigGo Finance
- [T2] Gold’s Dual Drivers: Central Bank Flows and Real Yields, According to Societe Generale | Forex News | CryptoRank.io
- [T3] Central Bank Gold Purchases Hit 1,000t Average: WGC Survey
- [T4] Is it a golden era for gold? | J.P. Morgan Private Bank U.S.
- [T5] Gold’s slowdown doesn’t signal a reversal | Lombard Odier
- [T6] Central Bank Gold Reserves Survey 2026 | World Gold Council
- [T7] What Affects Gold Prices? 6 Key Factors Explained | XTB
- [T8] Gold: Between inflation fears and diversification of reserves
This report is AI-generated, for informational purposes only, and does not constitute investment advice, a recommendation, an offer or a solicitation to buy or sell any financial instrument.
Important Note / Wichtiger Hinweis:
EN: This report may have been generated using AI. It processes data from publicly available sources. The content is provided for informational purposes only.DE: Dieser Bericht kann mithilfe von KI erstellt worden sein. Dabei werden Daten aus öffentlich zugänglichen Quellen verarbeitet. Die Inhalte dienen ausschließlich Informationszwecken.
* DE: Die ergänzenden Inhalte können KI-generiert sein. EN: The additional content may be AI-generated.