
The altii-Gold-Report: Gold (XAU) in EUR
Published 2026-10-24 | Instrument: PAX Gold token as EUR-gold proxy | Data as of 2026-10-24 04:20 UTC unless stated otherwise
Watch the video
This player shows only the Gold chapter of the daily altii market briefing. Watch the full video on tube.altii.de.
Key Data Snapshot
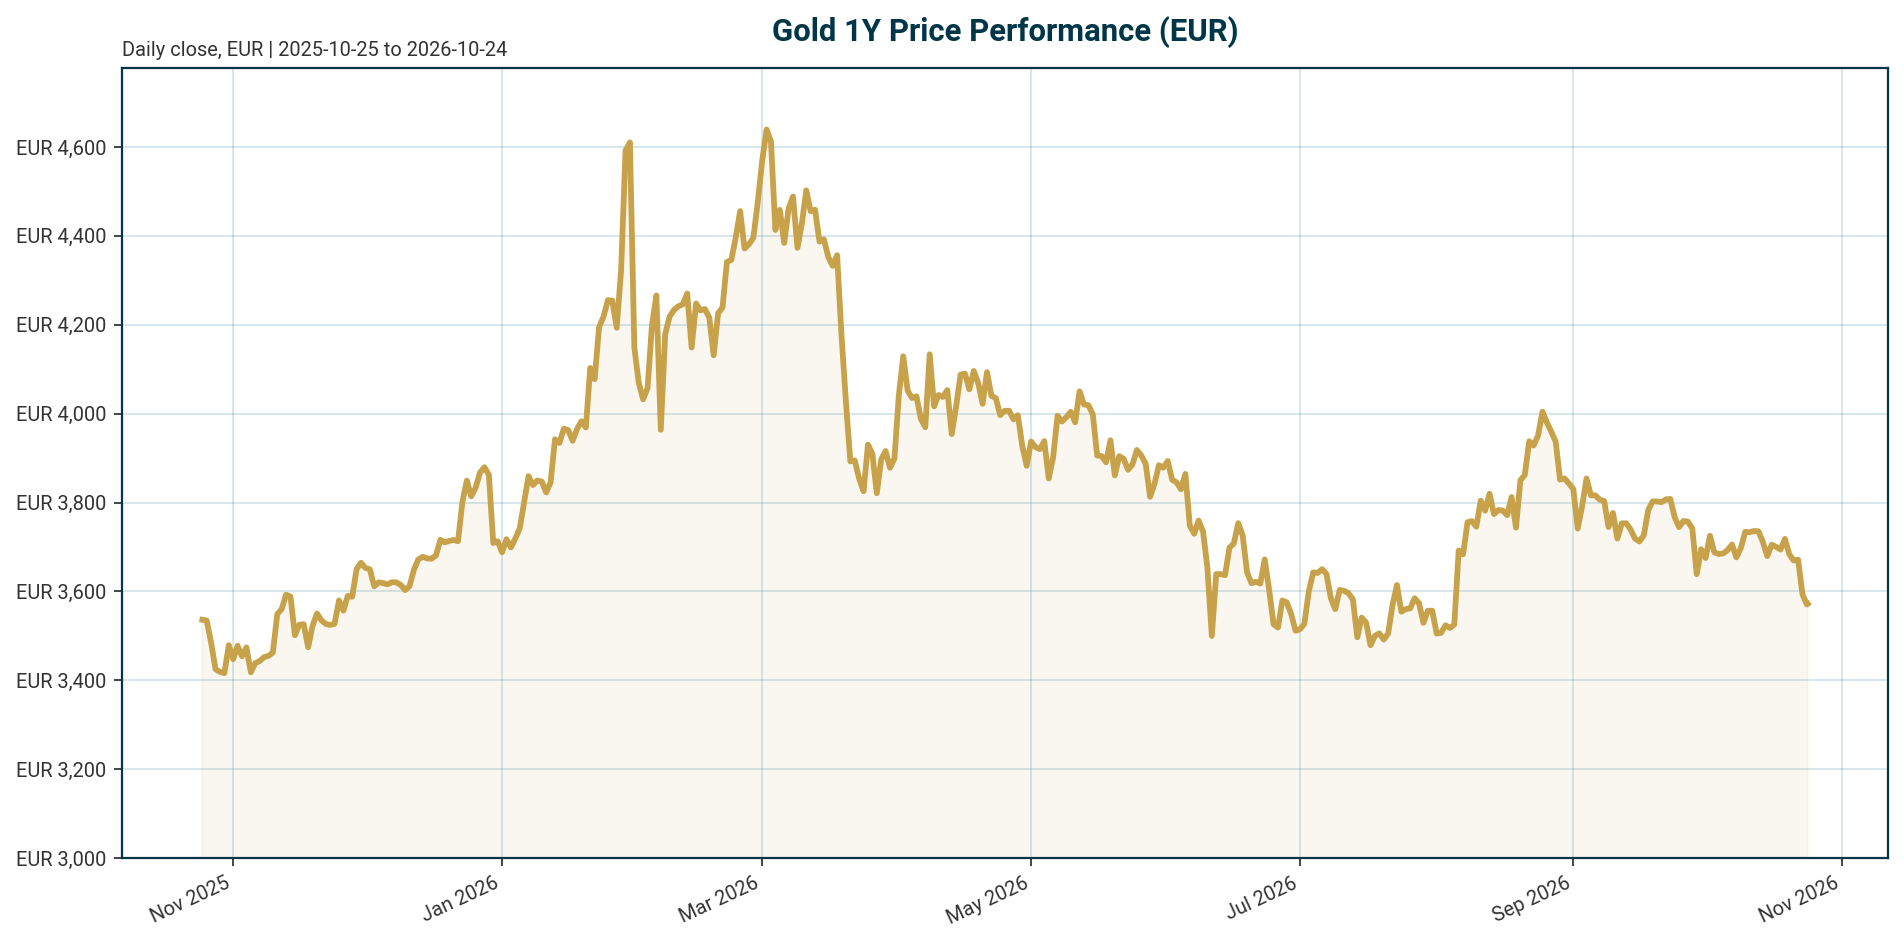
| Metric | Value | Change / Note |
|---|---|---|
| XAU/EUR price | 3,572.14 EUR | -0.32% (24h), -3.81% (7d) |
| 30d / 200d / 1y change | -6.70% / -13.66% / -2.77% | Corrective across horizons |
| All-time high | 4,688.32 EUR (2026-01-28) | -23.81% below; +31.25% upside to ATH |
| All-time low | 1,265.28 EUR (2019-11-17) | +182.32% above |
| Fed funds target range | 3.75% to 4.00% | Last change: +25 bp hike, effective 2026-09-17 |
| ECB deposit facility rate | 2.50% | Last change: +25 bp hike, effective 2026-09-16 |
| Euro Area AAA 10Y yield | 3.38% | -6.0 bp over 5 days (as of 2026-10-22) |
| Euro AAA 10Y-2Y spread | 37.7 bp | 30Y-10Y spread: ~23.3 bp (3.6177% minus 3.3844%) |
| EUR/USD | 1.1222 | -0.05% (5d), -4.49% YTD |
| Risk sentiment | Negative | DAX -0.55% (5d), Hang Seng -4.52% (5d) |
| PAX Gold market cap | 1.586 bn EUR (rank 57) | 24h volume 123.2 mn EUR, ~7.8% of market cap |
Calculation check: drawdown from ATH = (3,572.14 / 4,688.32) – 1 = -23.81%, matching the bundle figure. Upside to ATH = (4,688.32 / 3,572.14) – 1 = +31.25%.
Macro Backdrop
Market overview: Risk sentiment is negative and equity momentum is broadly negative, with DACH indices broadly in line with global peers (5-day average -2.09% versus -2.65% globally). The rates backdrop is mixed in the euro area: the Euro Area AAA 10Y yield stands at 3.38%, down 6.0 bp over five days, with a 10Y-2Y spread of 37.7 bp. FX is mixed, with EUR/USD at 1.1222, essentially flat over five days. The DAX shows the strongest 5-day move at -0.55% while the Hang Seng is weakest at -4.52%. This backdrop is defensive and, on balance, mildly supportive for gold, though it has not prevented a near-term EUR-gold pullback.
Policy is restrictive in both currency blocs. The Fed funds target range is 3.75% to 4.00% after a 25 bp hike effective 2026-09-17, and the ECB deposit facility rate is 2.50% after a 25 bp hike effective 2026-09-16. Bundesbank President Nagel defended the ECB’s June and September hikes of 25 bp each, according to an undated report [T1]. The same report cites Nagel flagging serious inflation risks after the US-Iran conflict, with oil rising from roughly $70 before the summer break to above $100, plus supply-side risks from low energy inventories and fertilizer shortages. That inflation narrative underpins the structural gold bid even as nominal rates stay high. Note that euro-area inflation expectations are not in the dataset, so a euro-area real yield cannot be computed here; US real yield levels are likewise unavailable.
Investment Thesis
The core thesis is that gold’s pricing logic is re-anchoring. The traditional inverse relationship with real yields, which averaged a rolling 12-month correlation of -0.73 from 2003 to roughly 2022, has partially decoupled since 2024-2025 because central bank demand replaced ETF flows as the marginal buyer [T6]. At the LBMA conference, participants noted gold held firmly above $4,000/oz even as US Treasury yields topped 5%, an undated news figure rather than bundle data [T1].
The structural pillar is official-sector demand. Central banks accumulated an average of 1,000t of gold per year over the past four years, double the 500t average of the preceding decade, per the World Gold Council’s 2026 survey [T5]. Q1 2026 net purchases reached 244t, which annualizes to roughly 976t, running essentially in line with the four-year average [T6]. Gold’s share of global central bank reserves has risen from roughly 14% in 2023 to nearly 25%, per Bundesbank’s Nagel as cited in an undated report [T1]. Survey drivers are durable: 92% of participants cite interest rate levels, 90% cite gold’s crisis performance, and 95% of EMDE institutions view geopolitical instability as a key allocation driver versus 67% in advanced economies [T2].
This framework explains the current tape: EUR-gold can correct 6.70% in 30 days and sit 23.81% below its January 2026 ATH while the structural bid stays intact. The bearish counter is that the debasement trade is crowded and, as the same report cautions, does not imply a one-way rally [T1].
Bullish Drivers
- Official-sector accumulation: 1,000t average annual purchases over four years [T5]; 863t in 2025 and 244t in Q1 2026, above the five-year average [T6]. A record 45% of 76 survey respondents expect their own reserves to rise over the next 12 months, and 89% expect global central bank reserves to increase [T5]. J.P. Morgan separately cites a record 43% of 73 monetary authorities expecting to increase their own reserves, in an undated piece [T3].
- Geopolitical hedging and repatriation: The Dutch Central Bank moved roughly 86 tonnes from the US and Canada to London between March and August 2026 for crisis preparedness; the US-stored share fell from 31.3% to 18.5%, with London now the largest location at 32.1% [T1]. Storage diversification is broader: Bank of England vaulting at 57%, domestic storage at 49%, BIS at 16% [T5].
- Inflation and debasement narrative: Oil above $100 after the US-Iran conflict keeps the purchasing-power argument alive [T1]. Lombard Odier argues the macro context favours real assets amid fiscal uncertainty and gradual erosion of purchasing power, and views higher yields and a stronger dollar as temporary headwinds, in a May 2026 piece [T4].
- Defensive demand: Negative risk sentiment and broadly negative equity momentum support defensive allocations (bundle market overview).
- Potential rate relief: Lombard Odier expects the Fed to stay on hold for much of 2026 with any cut more likely towards year-end; this is a dated market expectation, not a decision [T4].
Relative Positioning vs Bitcoin and Ethereum
The dataset does not include individual BTC or ETH prices, so a quantitative gold/BTC or gold/ETH ratio cannot be computed. What the bundle does show: total crypto market cap is 2.434 trillion USD with 57.96 billion USD of 24h volume, and BTC dominance at 59.47%. Converting at EUR/USD 1.1222, the crypto complex is roughly 2.17 trillion EUR, about 1,368 times the 1.586 billion EUR PAX Gold market cap. This is an approximate figure and the two figures measure different things: tokenized gold supply versus the full crypto complex.
Positioning is therefore qualitative. In the current negative-sentiment regime, gold’s crisis-hedge role, cited by 90% of central bank survey respondents [T2], and its zero-issuer-risk profile favour it over high-beta crypto as a defensive allocation [T7]. In a risk-on reversal, the scenario assumption is that flows would favour BTC and ETH over gold. That is a scenario, not a measurement. Ethereum is configured as a benchmark asset for this report, but no ETH price data is available in the dataset.
Scenario Framework
All scenarios are assumptions over the next 6 to 12 months, anchored on current levels: EUR-gold 3,572.14, ATH 4,688.32, Fed range 3.75% to 4.00%, ECB 2.50%, Euro AAA 10Y at 3.38%, EUR/USD 1.1222.
- Base case: The Fed and ECB hold at current levels; central bank buying stays near the 1,000t/yr pace [T5]; inflation narratives persist. EUR-gold consolidates below the January ATH, range-bound above recent correction lows.
- Bull case: A late-2026 Fed cut, per Lombard Odier’s dated expectation [T4], compresses real yields and re-engages private flows on top of the reserve bid. Geopolitical escalation keeps oil above $100 [T1]. Central bank buying accelerates from the Q1 2026 pace of 244t [T6]. EUR-gold retests the 4,688.32 EUR ATH region, which implies roughly +31.25% from current levels.
- Bear case: Higher-for-longer real yields [T4], a prolonged ETF demand decline, and weaker physical demand extend the 30-day -6.70% drawdown [T4]. A EUR rebound from 1.1222 would add mechanical EUR-quotation headwinds. UBS notes gold is pressured mainly because real yields have risen rapidly, in an undated piece [T8].
Valuation Discussion
Gold has no cash flows, so traditional valuation metrics do not apply. The opportunity-cost framework is the standard anchor: gold yields nothing, so real yields are its carrying cost [T7]. The historical inverse correlation of -0.73 held from 2003 to roughly 2022 but has partially decoupled as central banks became the marginal buyer [T6]. J.P. Morgan notes the real-yield relationship has broken down over the past two years and that gold’s inflation-hedge usefulness is often transitory, in an undated piece [T3].
What can be quantified: EUR-gold at 3,572.14 is 23.81% below its January 2026 ATH and 182.32% above its 2019 low. Euro AAA nominal yields of 3.38% (10Y) and 3.01% (2Y) set the euro-block opportunity cost, but euro-area inflation expectations are not in the dataset, so the real yield cannot be derived. US 10Y yields above 5% is an undated news figure [T1], not bundle data.
Two interpretations frame the valuation debate. If the structural reserve bid has permanently re-anchored pricing [T1], the current 23.81% drawdown is a reset within a higher regime, not a bubble unwind. If the real-yield relationship reasserts itself over the full cycle [T6], current prices embed a debasement premium that higher-for-longer rates could deflate. UBS expects a higher medium-term price despite current pressure [T8]. Both readings are interpretations, not facts.
Risks
- Policy risk: Both the Fed and ECB last moved with 25 bp hikes effective September 2026. Further tightening is a live scenario given the oil-driven inflation narrative [T1]; future moves are scenarios, not decisions.
- Real-yield risk: Higher-for-longer real yields are the primary listed risk [T4], and rapidly rising real yields are already pressuring gold per UBS [T8].
- Flow risk: A prolonged ETF demand decline or weaker jewellery demand, even partly offset by central bank buying [T4]. A slowdown in official-sector purchases from the 1,000t/yr pace would remove the marginal buyer. The bullish case leans heavily on this single pillar; ETF and physical demand data are not in the dataset.
- Currency risk: EUR/USD at 1.1222 is -4.49% YTD; a EUR rebound would mechanically depress EUR-quoted gold.
- Narrative risk: If oil retreats from above $100 [T1] and inflation expectations normalize, the debasement premium could compress. The debasement trade does not imply a one-way rally [T1].
- Sentiment risk: Negative risk sentiment currently supports gold; a sharp equity rebound would reduce defensive demand.
- Instrument risk: The tracked instrument is the PAX Gold token with thin 24h volume of roughly 123.2 mn EUR, about 7.8% of market cap. Token-specific dislocation and wrapper risk exist and prices may deviate from physical gold quotes.
Appendix
Methodology and Instrument Notes
The tracked instrument is the PAX Gold token (coingecko_id pax-gold), used as a proxy for XAU quoted in EUR. Market cap is 1.586 bn EUR, circulating supply 444,094.19, rank 57. The token tracks gold but carries wrapper and liquidity considerations; volume figures reflect token liquidity, not London or OTC gold market turnover. Market data was retrieved 2026-10-24T04:20:14Z; equity and rates data are as of 2026-10-22 or 2026-10-23; FX data as of 2026-10-24. Yield curve data comes from ECB AAA-rated euro area central government bond yields; FX from frankfurter; equities from STOXX, Wiener Boerse, and FMP.
Policy Rate Reference
- US Federal Funds Target Range: 3.75% to 4.00%, as of 2026-10-23; last change: hike of 25 bp, effective 2026-09-17.
- ECB Deposit Facility Rate: 2.50%, as of 2026-10-24; last change: hike of 25 bp, effective 2026-09-16.
Where a news source conflicts with the authoritative policy rate block, the bundle governs. Most Tavily items lack publication dates; figures drawn from them are flagged as undated news claims and should not be read as current market state.
Sources
- [T1] Gold Holds Above $4,000 Even as US Treasury Yields Top 5% — Institutions Say Gold’s Pricing Logic Is “Re-Anchoring” — BigGo Finance (undated)
- [T2] Central Bank Gold Purchases Hit 1,000t Average: WGC Survey (undated; survey collected Feb 5 to May 19, 2026)
- [T3] Is it a golden era for gold? | J.P. Morgan Private Bank U.S. (undated)
- [T4] Gold’s slowdown doesn’t signal a reversal | Lombard Odier (May 2026)
- [T5] Central Bank Gold Reserves Survey 2026 | World Gold Council (undated)
- [T6] How Gold Price Cycles Work: A Full Framework (undated; cites WGC Gold Demand Trends Q1 2026)
- [T7] What Affects Gold Prices? 6 Key Factors Explained | XTB (undated)
- [T8] Gold: Between inflation fears and diversification of reserves | UBS (undated)
Disclaimer
This report is AI-generated, for informational purposes only, and does not constitute investment advice. Figures should be verified against primary sources before any decision. Past performance is not indicative of future results.
Important Note / Wichtiger Hinweis:
EN: This report may have been generated using AI. It processes data from publicly available sources. The content is provided for informational purposes only.DE: Dieser Bericht kann mithilfe von KI erstellt worden sein. Dabei werden Daten aus öffentlich zugänglichen Quellen verarbeitet. Die Inhalte dienen ausschließlich Informationszwecken.
* DE: Die ergänzenden Inhalte können KI-generiert sein. EN: The additional content may be AI-generated.