
The altii-Gold-Report
Key Data Snapshot
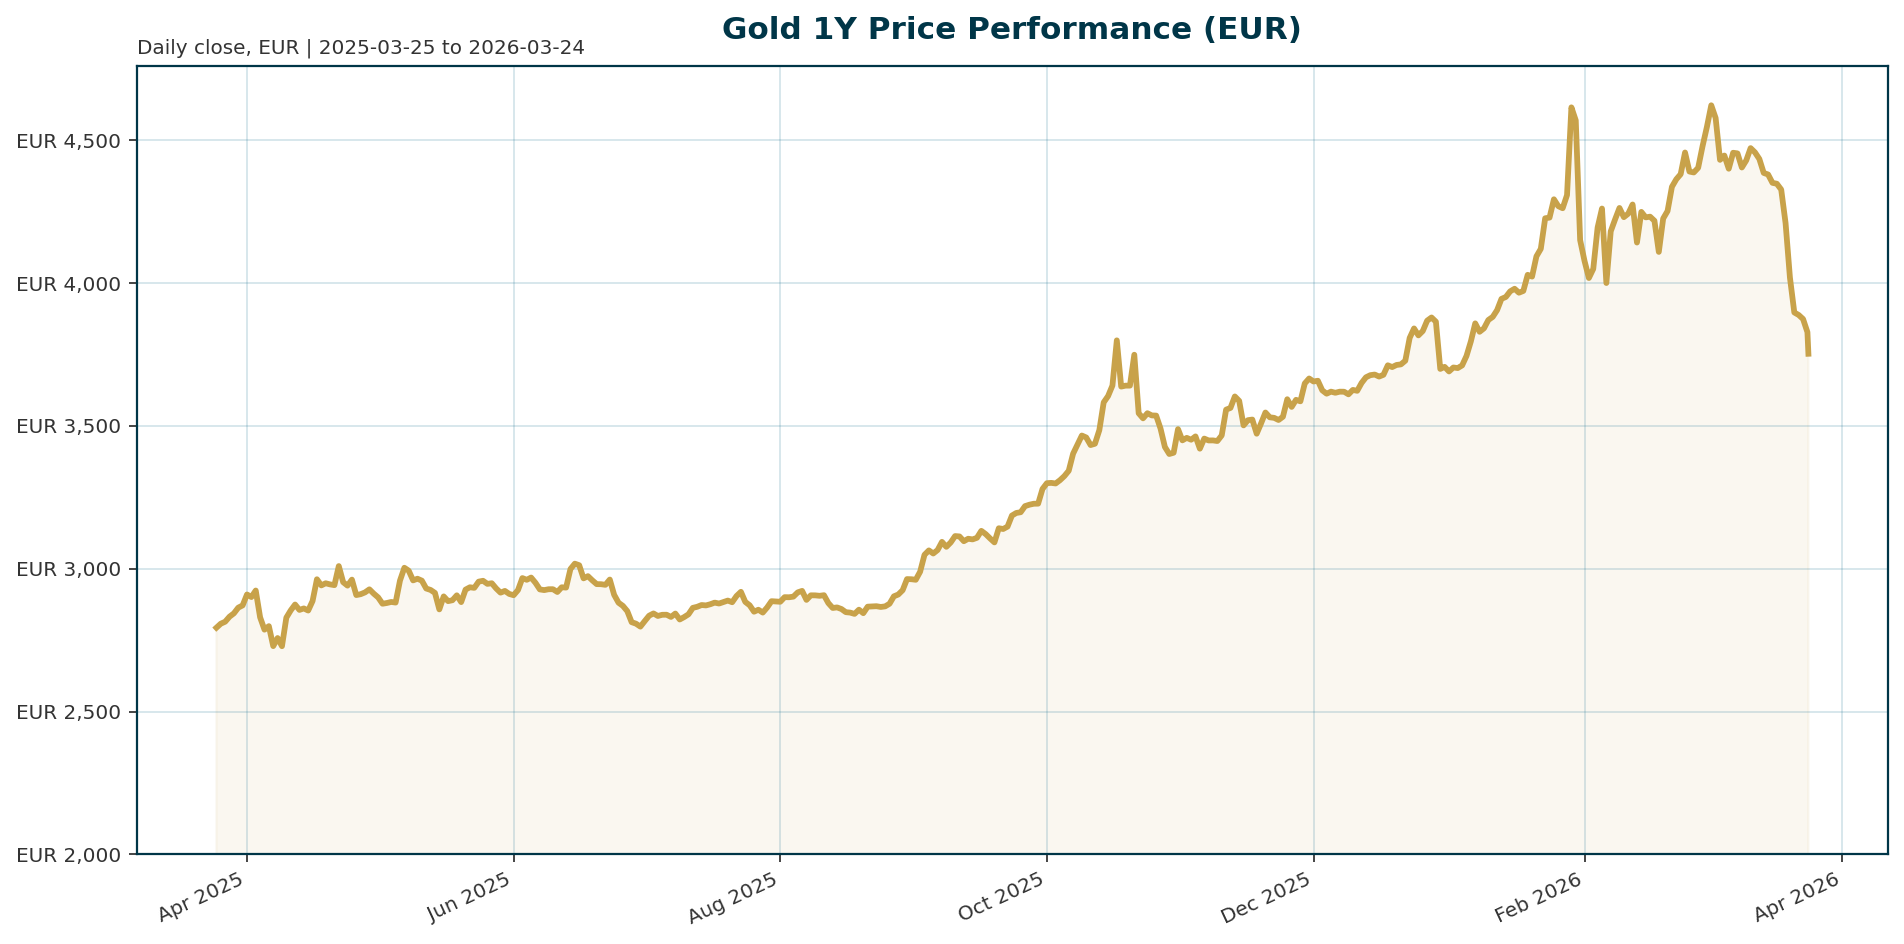
XAU trades at 3,747.21 EUR after a sharp correction from its January 2026 all-time high of 4,688.32 EUR. The asset has underperformed over the last week, posting a -14.26% decline, though it remains up +33.18% over the last 12 months. BTC dominance stands at 56.57%, indicating strong capital rotation into risk assets.
| Metric | Value | Change / Context |
|---|---|---|
| Current Price (EUR) | 3,747.21 | Current Level |
| All-Time High (ATH) | 4,688.32 | |
| Drawdown from ATH | -20.1% | Calculated: (4688.32 – 3747.21) / 4688.32 |
| 7-Day Change | -14.26% | Sharp correction phase |
| 1-Year Change | +33.18% | Long-term uptrend intact |
| BTC Dominance | 56.57% | High risk-on sentiment |
Macro Backdrop
The current price action reflects a complex interplay between hawkish monetary policy and persistent inflationary pressures. The Federal Reserve has signaled a “higher-for-longer” stance, keeping rates steady while projecting higher inflation. This has pushed real yields higher, making non-yielding gold less attractive [T2][T7].
Concurrently, the ongoing conflict in the Middle East has disrupted energy supplies via the Strait of Hormuz, keeping oil prices elevated above $100/barrel. This creates a stagflationary environment—sluggish growth coupled with persistent inflation—which historically favors gold [T1][T5]. However, immediate market reaction is dominated by the fear of tighter monetary policy from the Fed and potential rate hikes from the ECB and BoE in April [T3].
Investment Thesis
Despite the short-term headwinds from rising real yields, the long-term investment thesis for gold remains robust. The primary driver is the deteriorating fiscal picture in the United States. Analysts note that the US gold reserves now equate to only about 3% of federal debt, a stark contrast to the 51% ratio in the 1940s. This massive imbalance suggests that policymakers may eventually be compelled to monetize debt, a scenario that historically supports higher gold prices [T1][T4].
The current pullback represents a valuation reset rather than a trend reversal. With sluggish growth and ballooning government debt resembling a stagflationary setup, the demand for hard assets as a store of value is increasing [T1].
Bullish Drivers
- Wall Street Targets: Major institutions remain broadly bullish, with price targets well above current levels, pointing to $6,000 or more for the year-end [T1].
- Portfolio Allocation: Legendary investor Ray Dalio has emphasized that a well-diversified portfolio requires between 10% and 15% allocation to gold [T1].
- Fed Pivot Potential: While the Fed is currently hawkish, projections indicate rates could decrease to 3.4% by year-end. A pivot to rate cuts would likely trigger a significant rally in gold [T2][T7].
- Debt Sustainability: The unsustainable level of global debt creates a structural bullish case for gold as a hedge against currency debasement and fiscal crisis [T4].
Relative Positioning vs Bitcoin and Ethereum
Gold has experienced a notable divergence from the cryptocurrency market over the past week. As BTC dominance surged to 56.57%, capital rotated out of traditional safe havens into high-beta risk assets. This mirrors historical precedents where gold initially sold off during macro-economic shocks (2008, 2020, 2022) as investors sought liquidity in the dollar, only to rally sharply once the dust settled [T8].
The current rotation suggests gold may be oversold relative to the long-term debt narrative. If risk assets face renewed pressure, a rotation back into gold is a likely outcome.
Scenario Framework
- Base Case: The Fed holds rates steady, inflation remains sticky due to energy costs, and the conflict in the Middle East de-escalates slightly. Gold consolidates in a range between 3,700 and 4,000 EUR.
- Bull Case: Geopolitical tensions ease, and the Fed begins cutting rates in H2 2026. Real yields fall, and gold retests its ATH at 4,688.32 EUR, potentially targeting $6,000 [T1][T4].
- Bear Case: The conflict in the Middle East escalates, forcing the Fed to maintain restrictive policy. Real yields spike, and gold breaks below the 3,500 EUR support level.
Valuation Discussion
Gold is currently priced at a significant discount to its recent highs, offering an attractive entry point relative to the macroeconomic backdrop. While the price action has erased 20% of its gains from the ATH, the fundamental valuation metrics suggest the metal is undervalued.
Key to this valuation is the debt-to-reserve ratio. With US gold reserves covering only 3% of federal debt, the market is not fully pricing in the potential for gold to serve as a primary hedge against fiscal insolvency. The recent drop may have overcorrected for short-term rate sensitivity, leaving room for upside as the debt narrative resurfaces [T1][T4].
Risks
- Real Yield Spike: If energy prices remain elevated, the Fed may be forced to keep rates higher for longer, capping gold’s upside [T2][T7].
- Central Bank Selling: Some nations may be compelled to sell gold reserves to fund energy purchases or defend their currencies amid the dollar shortage caused by the Hormuz blockade [T8].
- Margin Liquidation: Forced selling in leveraged positions could exacerbate the current downtrend, particularly if the price breaks key support levels [T6].
Appendix
- Sources:
- Gold’s biggest drop in decades hides a powerful tailwind – thestreet.com [T1]
- Gold, silver hit one-month lows on hawkish Fed: will downtrend deepen? – CryptoRank [T2]
- Gold rises but face third straight weekly drop on higher rate outlook – KITCO [T3]
- Gold pullback offers profit opportunity as debt risks grow, says analyst – Invezz [T4]
- Gold little changed as investors assess Middle East fallout ahead of policy decisions – CNBC [T5]
- Gold Trims Losses But Inflation Fears Keep Pressure On – WSJ [T6]
- Gold eases as inflation fears bolster hawkish Fed bets – KITCO [T7]
- Gold and Silver Rebound as Trump Postpones Iran Energy Strikes – Yahoo Finance [T8]
- Disclaimer: This report is AI-generated for informational purposes only and does not constitute investment advice. The analysis provided is based on data available as of March 24, 2026. Readers should conduct their own due diligence before making investment decisions.
Important Note / Wichtiger Hinweis:
EN: This report may have been generated using AI. It processes data from publicly available sources. The content is provided for informational purposes only.DE: Dieser Bericht kann mithilfe von KI erstellt worden sein. Dabei werden Daten aus öffentlich zugänglichen Quellen verarbeitet. Die Inhalte dienen ausschließlich Informationszwecken.
* DE: Die ergänzenden Inhalte können KI-generiert sein. EN: The additional content may be AI-generated.