
Listen to the summary
Key Data Snapshot
| Metric | Value | Change (24h) |
|---|---|---|
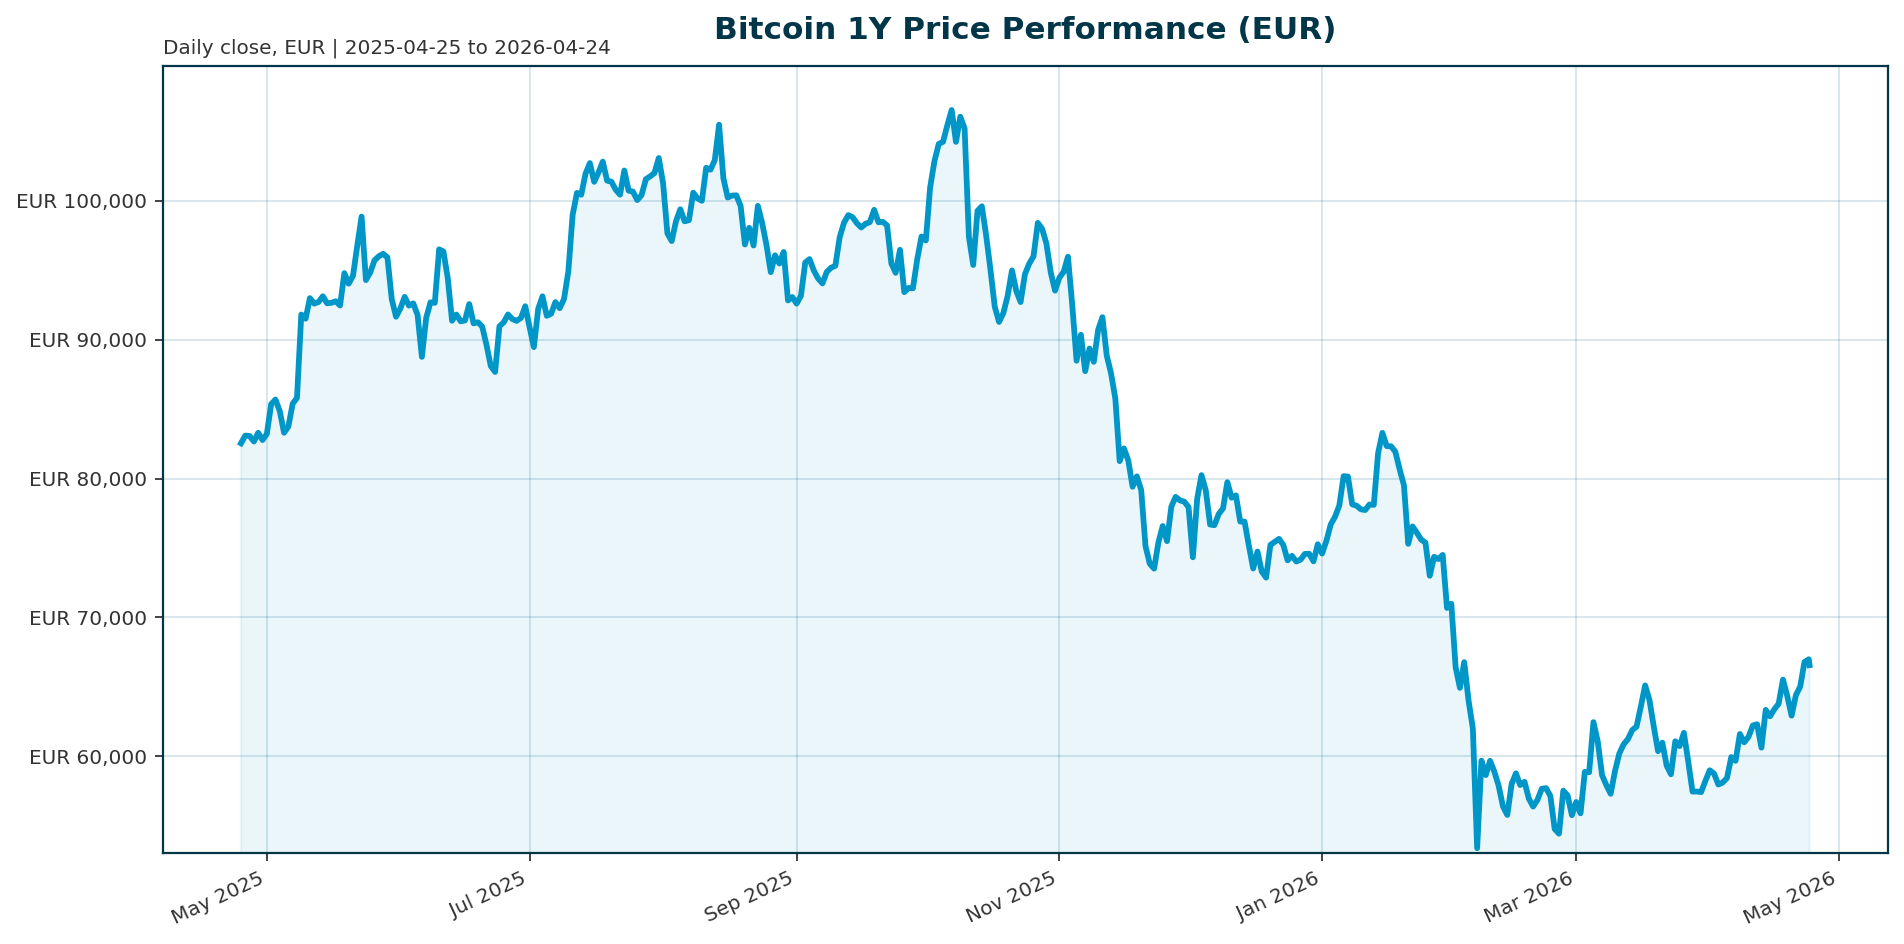
| Price (EUR) | 66,567.00 | -0.03% |
| Market Cap (EUR) | 1.33T | +0.01% |
| 24h Volume (EUR) | 33.15B | N/A |
| ATH (EUR) | 107,662.00 | -38.17% |
| BTC Dominance | 58.11% | N/A |
| Circulating Supply | 20,019,946.00 | N/A |
Market Setup
Risk sentiment remains neutral to positive as global equities show divergent performance. The Eurozone is under pressure, with the DAX and Euro Stoxx 50 both down over 2% over the last five days, while the Nasdaq Composite leads global peers with a strong one-month gain of 12.30%. The Euro Area 10-year yield sits at 3.05%, creating a mixed backdrop for risk assets. Bitcoin has demonstrated resilience during this period, proving to be a more effective geopolitical shock absorber than oil or equities during renewed U.S.-Iran tensions.Investment Thesis
The investment thesis has evolved from speculative access to structural integration. Institutional capital is no longer circling crypto but is actively deploying, with BlackRock’s IBIT and Morgan Stanley’s MSBT leading the charge. The market has entered “Phase Two,” where Bitcoin is being packaged into volatility-dampened, yield-generating products for conservative investors. This shift aims to unlock the $144 trillion wealth-advisory market, moving beyond simple exposure to a core allocation strategy.Bullish Drivers
The primary bullish catalyst remains the sustained flow of institutional capital into spot ETFs. BlackRock’s IBIT led all ETFs with $612 million in inflows in a single week, demonstrating the power of the world’s largest asset manager [T3]. The supply shock narrative is intact, as ETF demand grows while the Bitcoin supply cap remains fixed. Furthermore, the asset is increasingly viewed as a hedge against geopolitical tail risks, with institutional investors actively using it to mitigate contagion effects from conflicts like the U.S.-Iran situation [T4].Relative Positioning vs Gold and Ethereum
Bitcoin and Gold occupy distinct but complementary roles in a portfolio. Gold remains the superior short-term inflation hedge, returning +65% in 2025 and +127% over five years, acting as a “bunker” during geopolitical shocks [T8]. Bitcoin, conversely, has outperformed Gold over the longer term (5-year +203% vs +127%) but acts more like a tech stock than a traditional safe haven. Ethereum is trading at approximately 2,298 EUR, showing similar correlation to tech equities and lagging behind Bitcoin’s institutional momentum.Scenario Framework
- Bullish Scenario: Regulatory clarity regarding secondary custodians alleviates concentration risks. ETF demand accelerates as yield-generating products gain traction, potentially pushing BTC above $100,000.
- Base Case: Bitcoin consolidates between 65,000 and 75,000 EUR. The ETF bid acts as a reliable floor, absorbing geopolitical shocks without breaking key technical levels.
- Bearish Scenario: A regulatory freeze order or operational failure at a primary custodian triggers a liquidity crunch. Given that roughly $77 billion of U.S. institutional Bitcoin sits with Coinbase, this concentration risk remains the primary downside driver [T2].
Valuation Discussion
Bitcoin is currently trading at 61.8% of its all-time high, reflecting a significant drawdown from the 107,662 EUR peak. Despite the correction, the market capitalization remains robust at 1.33 trillion EUR. Valuation is increasingly driven by institutional flows rather than speculative retail frenzy. The market cap to 24h volume ratio suggests healthy liquidity, supporting the view that the asset is maturing into a standard financial instrument.Risks
The most significant risk to the current thesis is custody concentration. Roughly $77 billion of the U.S. institutional Bitcoin footprint sits with Coinbase, making the sector vulnerable to a single regulatory intervention or operational failure [T2]. Additionally, new ETF strategies involving complex derivatives may face uncharted territory during extreme market volatility, as warned by MFS Investment Management [T7]. Finally, a sharp rise in Euro Area yields could pressure the asset through the risk-parity channel.Appendix
Sources
- Asia Is Rewiring Finance As Institutions Move Onchain – Forbes [T1]
- ‘Choke Point’—Bitcoin’s $77B Coinbase ETF Warning Shocks Markets – Forbes [T2]
- ‘Mission Accomplished’—BlackRock Suddenly Bets $871M On Bitcoin Dip – Forbes [T3]
- Bitcoin, ether, solana slide, oil jumps on renewed U.S.-Iran war risks – CoinDesk [T4]
- Morgan Stanley’s $116M Bitcoin ETF debut is tiny next to $1.9T, and that’s why Wall Street will notice – Bitget [T5]
- Podcast: What Paxos CEO Charles Cascarilla Sees in 2026 That His 2015 Self Missed – PYMNTS.com [T6]
- If a violent downturn strikes the market, new ETF strategies may be vulnerable. Here’s why – CNBC [T7]
- Beyond the memes: Understanding the unique roles of gold and Bitcoin – New York Post [T8]
This report is AI-generated for informational purposes only and does not constitute investment advice. The views expressed herein are those of the author and do not reflect the official policy or position of any agency, employer, or company.
Important Note / Wichtiger Hinweis:
EN: This report may have been generated using AI. It processes data from publicly available sources. The content is provided for informational purposes only.DE: Dieser Bericht kann mithilfe von KI erstellt worden sein. Dabei werden Daten aus öffentlich zugänglichen Quellen verarbeitet. Die Inhalte dienen ausschließlich Informationszwecken.
* DE: Die ergänzenden Inhalte können KI-generiert sein. EN: The additional content may be AI-generated.