
Listen to the summary
Key Data Snapshot
| Metric | Value | Change (Period) |
|---|---|---|
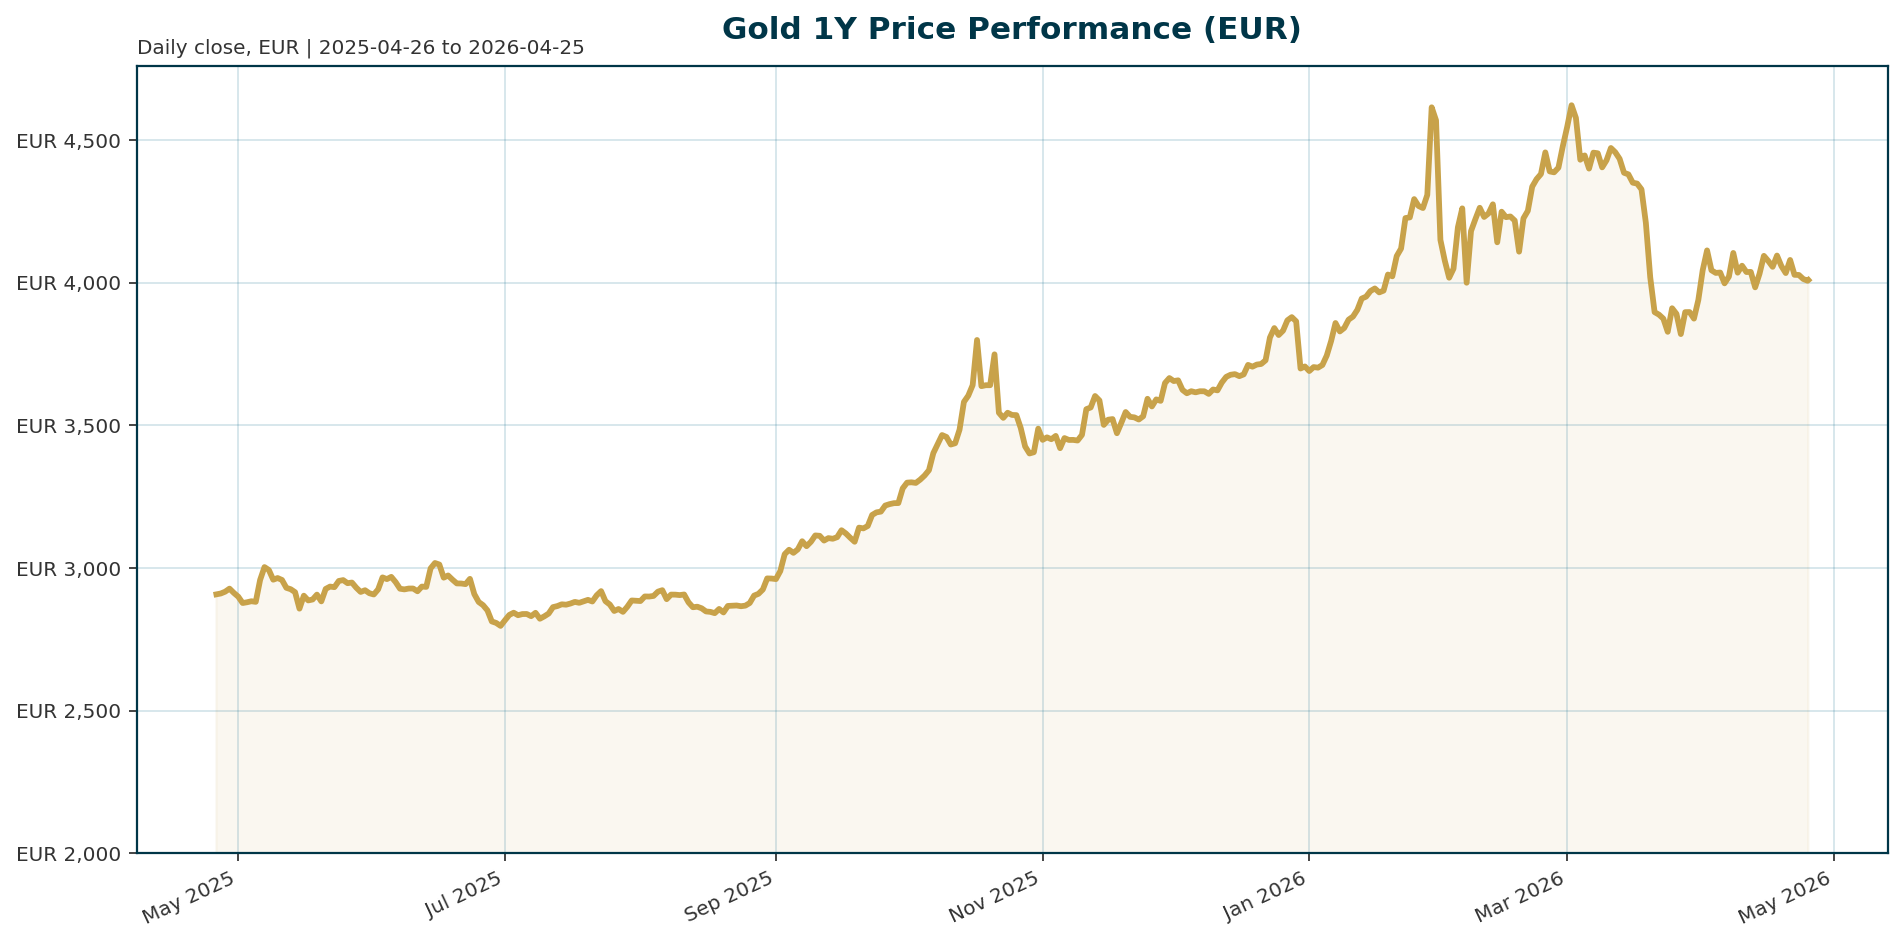
| Price (EUR) | 4,009.52 | 7D: -1.99% |
| Year-to-Date | — | +35.53% |
| All-Time High | 4,688.32 | -14.48% (Jan 2026) |
| BTC Dominance | 58.09% | — |
Macro Backdrop
Global risk sentiment is broadly positive, driven by a 13.25% one-month gain in the Nasdaq Composite, though DACH equities are lagging with the ATX down 1.92% over five days. The Euro area yield curve is flattening, with the 10-year yield at 3.07% and the 2-year at 2.54%. The EUR/USD pair is depreciating (-0.67% 5d), while the US dollar faces headwinds from hawkish Fed commentary and potential overvaluation according to Kenneth Rogoff [T7].
Investment Thesis
Gold is currently digesting a 40% rally from late 2025, with the recent pullback representing a technical pause rather than a reversal of the underlying bull market [T4]. The investment thesis rests on gold’s role as a hedge against persistent US fiscal imbalances and a potential dollar correction. Despite hawkish signals from Fed nominee Kevin Warsh [T1], structural support from central bank diversification remains robust.
Bullish Drivers
- Central Bank Diversification: Official-sector demand remains resilient. The People’s Bank of China added 5 tonnes in March, marking its 17th consecutive monthly purchase [T1]. New entrants like Uganda have begun domestic gold purchase programs to diversify reserves [T6].
- USD Overvaluation: Kenneth Rogoff forecasts a 15-20% downside for the USD, which would provide a significant tailwind for gold [T7].
- Geopolitical Tension: Ongoing conflicts in the Middle East, including the Strait of Hormuz, continue to fuel inflation expectations and safe-haven flows [T3].
- SNB Stance: The Swiss National Bank has no plans to alter its gold reserves, signaling no imminent selling pressure [T2].
Relative Positioning vs Bitcoin and Ethereum
With BTC dominance at 58.09%, gold competes for safe-haven flows in a high-risk environment. However, gold’s 1-year performance of +35.53% highlights its resilience compared to the extreme volatility seen in the crypto asset class. Gold is increasingly viewed as a bridge asset between traditional finance and digital alternatives.
Scenario Framework
- Base Case: The Fed holds rates at the upcoming FOMC meeting (99.5% probability) [T3]. Gold consolidates around 4,000 EUR supported by central bank buying.
- Bull Case: The USD corrects 15-20% [T7] and the Fed signals a pivot in late 2026. Gold breaks the 4,688.32 EUR ATH to target 5,000+ EUR.
- Bear Case: Warsh confirms a hawkish stance, real yields spike, and gold corrects further to 3,500 EUR.
Valuation Discussion
At 14.5% below the January 2026 ATH, gold is not in a bubble but is in a correction phase [T4]. Valuation metrics should be assessed against real yields and central bank demand rather than historical price levels.
Risks
- ETF Outflows: Short-term pressure comes from record ETF outflows, with global physically-backed funds recording $12 billion in net outflows in March [T1].
- Inflation Persistence: A persistent inflation environment could delay Fed rate cuts indefinitely, keeping real yields elevated and weighing on the non-yielding metal [T3].
Appendix
Sources
- Gold eases from one-week bounce as Iran truce holds and Warsh signals hawkish tilt – TechStock² [T1]
- Swiss central bank has no plans to increase gold reserves, says chairman – KITCO [T2]
- Gold and silver prices weaken ahead of FOMC meeting – IDNFinancials.com [T3]
- Gold slides below $4,700; why experts see a plateau, not a collapse – TradingView [T4]
- Ghana mineworkers warn local outsourcing rule will cut wages, jobs – Mining.com [T5]
- Uganda’s central bank starts domestic gold purchase program – Mining.com [T6]
- USD overvalued, Kenneth Rogoff sees another 15-20% downside – CNBC [T7]
- Persistent inflation hurts confidence in the U.S. dollar: Analyst – CNBC [T8]
This report is AI-generated for informational purposes only and does not constitute investment advice. Always conduct your own due diligence before making financial decisions.
Important Note / Wichtiger Hinweis:
EN: This report may have been generated using AI. It processes data from publicly available sources. The content is provided for informational purposes only.DE: Dieser Bericht kann mithilfe von KI erstellt worden sein. Dabei werden Daten aus öffentlich zugänglichen Quellen verarbeitet. Die Inhalte dienen ausschließlich Informationszwecken.
* DE: Die ergänzenden Inhalte können KI-generiert sein. EN: The additional content may be AI-generated.