
Listen to the summary
Key Data Snapshot
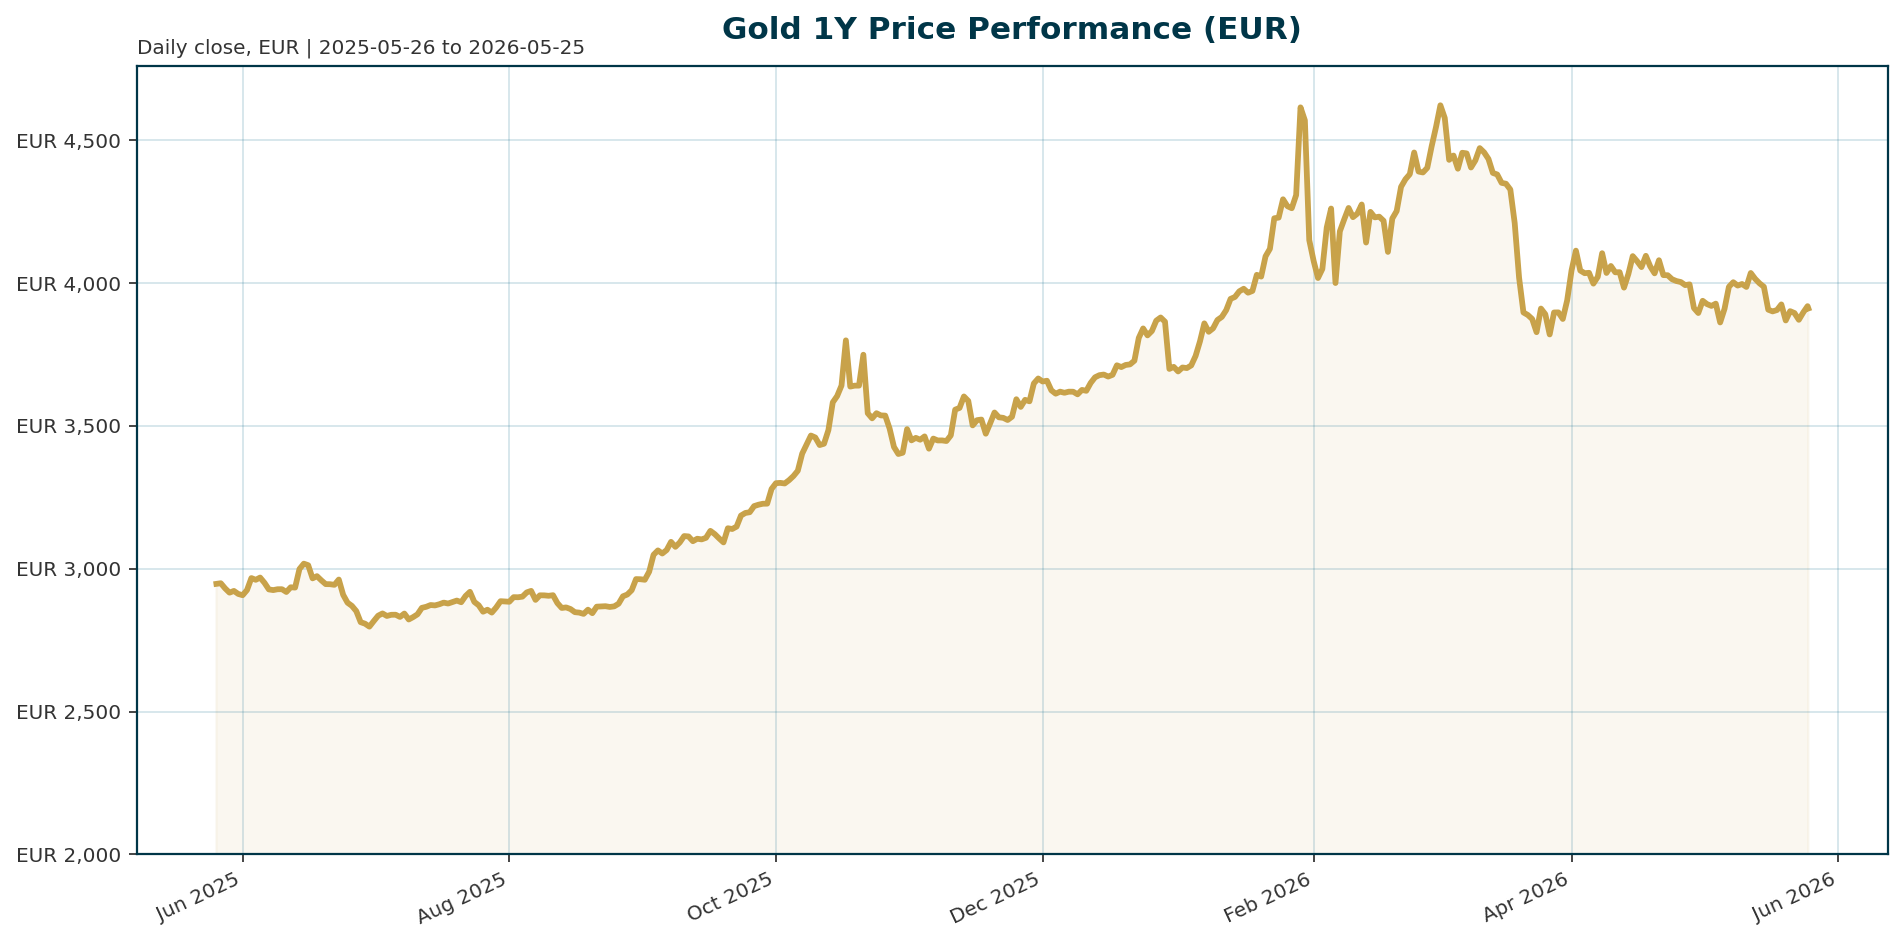
Gold (XAU) trades at 3909.92 EUR, consolidating near recent lows after a 16.6% drawdown from the January 2026 all-time high of 4688.32 EUR. The metal is up 32.1% year-to-date but has slipped 2.5% over the last 30 days. Despite bearish pressure from elevated US real yields, the 200-day moving average remains positive at +13.2%. The current implied USD price is approximately 3365, offering a discount to the ATH.
| Metric | Value | Change / Context |
|---|---|---|
| Price (XAU) | 3909.92 EUR | +0.09% (24h) |
| 30-Day Change | -2.47% | Retracement from ATH |
| Year-to-Date | +32.11% | Strong performance |
| ATH (Jan 2026) | 4688.32 EUR | -16.61% drawdown |
| 200-Day MA | 3455.00 EUR | +13.17% vs price |
| Volume (24h) | 99.46 M EUR | High liquidity |
| BTC Dominance | 58.29% | Market share |
Macro Backdrop
Global equity risk sentiment is positive, with the Nikkei 225 leading gains at 7.78% over five days, while the DAX and Euro Stoxx 50 also register moderate increases. The Euro area yield curve is mixed, with the 10-year yield at 3.14% and the 2-year yield at 2.63%. However, the backdrop for gold is complicated by elevated US real yields exceeding 5% on the 30-year Treasury, which increases the opportunity cost of holding non-yielding assets. The EUR/USD pair sits at 1.162, offering slight support to EUR gold, though the dollar remains near a six-week high, pressuring the metal.
Investment Thesis
The investment thesis for gold remains bifurcated. On the bearish side, surging US real yields above 5% and a 40-58% probability of a December Fed rate hike [T2][T4] are creating significant headwinds. Conversely, the bullish case rests on structural demand. Central banks, exemplified by Ghana’s push to secure 30% of miner output [T3], are aggressively diversifying reserves. Furthermore, veteran strategist Jeff Currie argues that gold is the “most asymmetric trade” in history, projecting a pullback to $4,000/oz before a surge toward $10,000/oz driven by energy crises and fiscal debt concerns [T5][T8].
Bullish Drivers
Primary bullish drivers include sustained central bank accumulation. Ghana’s central bank aims to purchase 30% of industrial miner output to boost reserves [T3], a trend mirrored globally. Geopolitical risks in the Middle East, specifically the Iran conflict, provide a floor for prices. If the conflict escalates, oil prices above $100/barrel could reignite inflation fears, forcing a Fed pivot [T2][T4]. Additionally, the long-term structural demand for gold as a hedge against fiscal debt and energy costs provides a robust foundation for price discovery beyond current short-term volatility.
Relative Positioning vs Bitcoin and Ethereum
Gold currently trades with a negative correlation to real yields and the US dollar, contrasting with the positive correlation often seen between gold and equities. While Bitcoin dominance stands at 58.29%, gold maintains its status as the primary reserve asset. Gold’s performance relative to Ethereum is currently muted by the high-for-longer rate environment, which penalizes non-yielding assets. However, gold’s role as a safe-haven anchor ensures it remains the benchmark against which crypto assets are measured during periods of systemic stress.
Scenario Framework
- Base Case (Consolidation): The Fed maintains a hawkish stance, keeping real yields above 5%. Gold consolidates between 3800 and 4000 EUR, reflecting a tug-of-war between central bank buying and high opportunity costs.
- Bullish Case: A breakthrough in Middle East peace talks cools inflation expectations. The Fed delays rate cuts until 2027. Gold breaks resistance, targeting the 4500 EUR level.
- Bearish Case: Oil prices spike above $120/barrel due to renewed conflict, forcing the Fed to hike rates. Real yields surge, and the dollar strengthens. Gold tests the 3500 EUR support level.
Valuation Discussion
Valuation is currently attractive relative to the January 2026 all-time high of 4688.32 EUR, representing a 16.6% drawdown. The implied USD price of approximately 3365 [calculated] offers a discount to the ATH. However, valuation is constrained by the opportunity cost of holding gold. With 30-year US Treasury yields exceeding 5% [T1], gold must offer a compelling hedge against inflation and currency debasement to justify its premium over yield-bearing assets.
Risks
The primary risk is a further rise in US real yields. If the Fed maintains a “higher for longer” policy to combat sticky inflation, gold could face additional downward pressure. Conversely, a rapid de-escalation of the Middle East conflict could trigger a “risk-on” melt-up, where investors rotate out of safe havens into equities and growth assets, leading to a sharp price correction in gold.
Appendix
Sources
- Gold prices play a good role as a shelter, silver has a large growth potential – Laodong.vn [T1]
- Gold steadies as high Treasury yields offset Mideast peace hopes – KITCO [T2]
- Ghana seeks to buy 30% of gold from miners to boost reserves, central bank – Mining.com [T3]
- Gold set for weekly loss as oil-driven inflation fears boost rate-hike bets – Reuters [T4]
- Jeff Currie sees gold price pullback before $10,000 run – Bitget [T5]
- NY Fed’s Perli says rate control toolkit can navigate lower reserve demand – KITCO [T6]
- RESERVE MANAGEMENT AND THE FED’S SYSTEM OPEN MARKET ACCOUNT: RECENT EXPERIENCE AND INSIGHTS FROM SURVEYS – InsuranceNewsNet [T7]
- Jeff Currie sees gold price pullback before $10,000 run – Mining.com [T8]
This report is AI-generated by GLM 4.7 Flash for informational purposes only and does not constitute investment advice. The analysis is based on data available as of May 25, 2026.
Important Note / Wichtiger Hinweis:
EN: This report may have been generated using AI. It processes data from publicly available sources. The content is provided for informational purposes only.DE: Dieser Bericht kann mithilfe von KI erstellt worden sein. Dabei werden Daten aus öffentlich zugänglichen Quellen verarbeitet. Die Inhalte dienen ausschließlich Informationszwecken.
* DE: Die ergänzenden Inhalte können KI-generiert sein. EN: The additional content may be AI-generated.