
Listen to the summary
Key Data Snapshot
| Metric | Value |
|---|---|
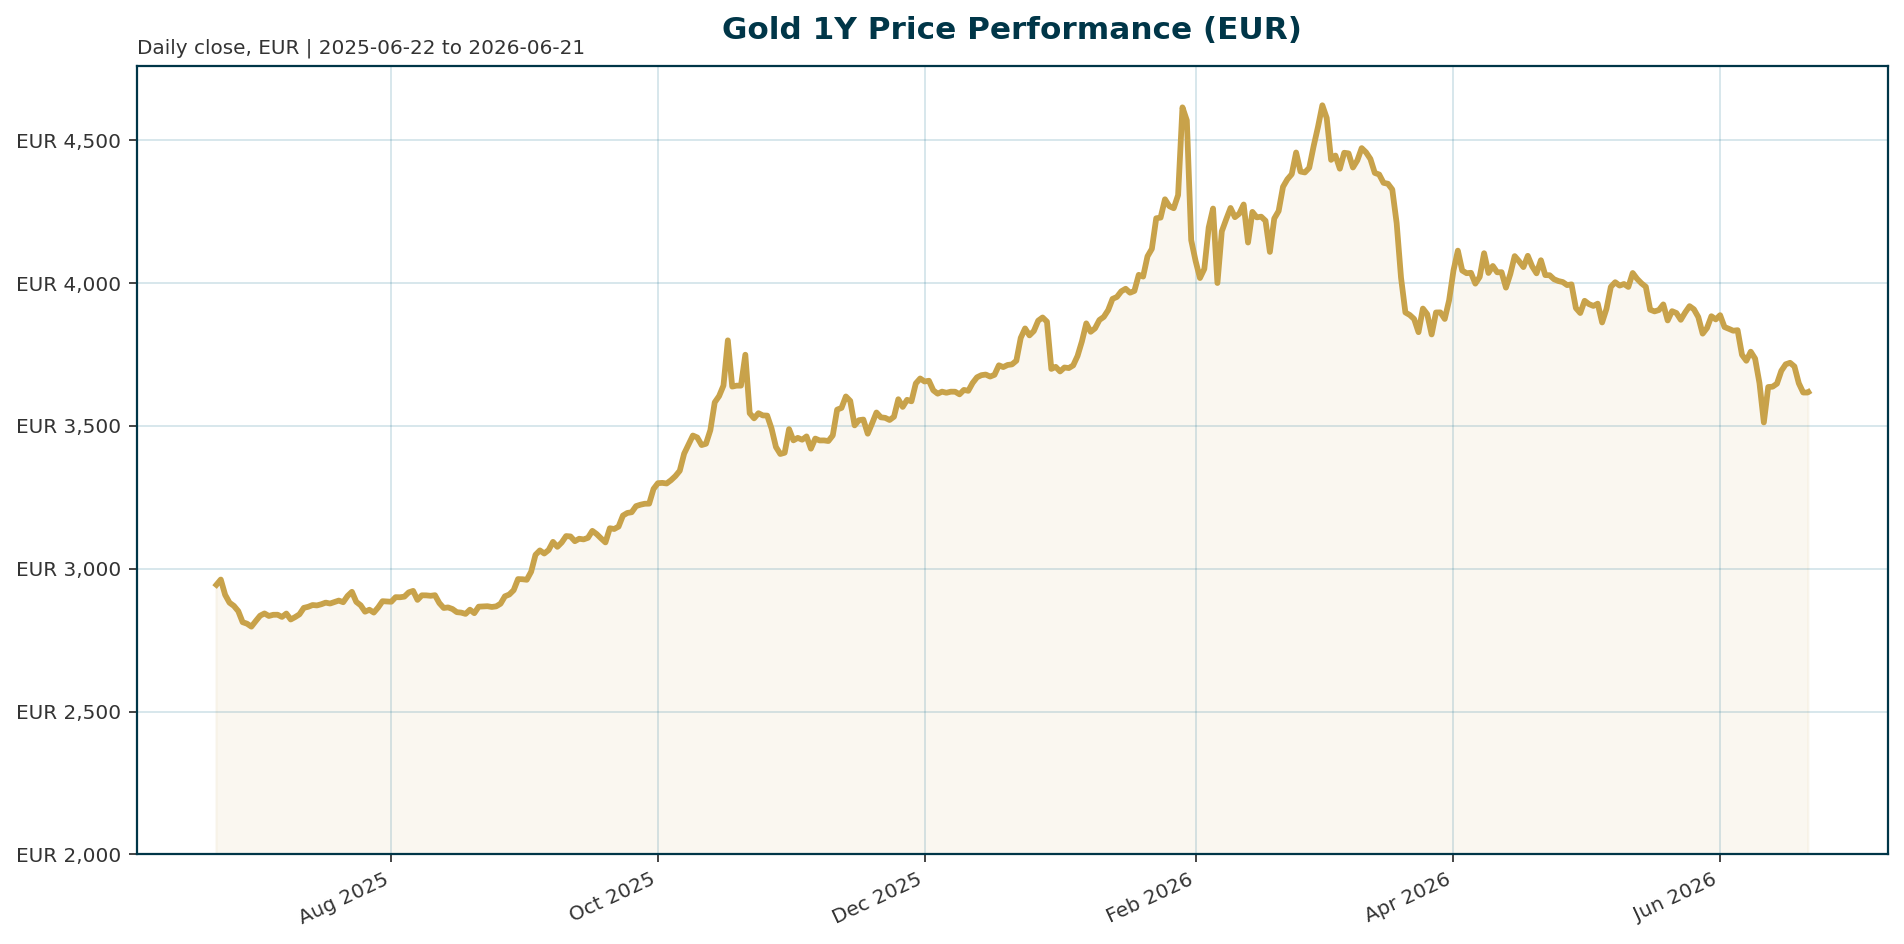
| Current Price (XAU/EUR) | 3,618.79 |
| 30-Day Change | -6.93% |
| 1-Year Change | +23.01% |
| All-Time High (USD) | 4,688.32 (Jan 2026) |
| All-Time High (EUR Est.) | 5,385.14 |
| BTC Dominance | 56.30% |
| Gold ETF AUM (Jan 2026) | $669 billion |
Macro Backdrop
Risk sentiment remains positive, driven by strong equity performance in Japan and Europe, which creates a near-term headwind for safe-haven demand. The rates backdrop is mixed with a flattening curve, as the Euro area AAA 10Y yield sits at 2.99% while the 2Y yield is at 2.55%. The FX backdrop shows the EUR is weaker against the USD at 1.1483. Key observations include the Nikkei 225 leading with a 5-day gain of 2.79%, while the Hang Seng lags with a -3.21% decline. The DAX is moderately positive at 1.42% over 5 days, indicating a divergence between global and regional equity momentum.Investment Thesis
Gold has transitioned from a peripheral monetary hedge to a core reserve asset, recently surpassing U.S. Treasuries to become the world’s largest reserve asset [T3]. The fundamental thesis rests on a permanent structural shift in reserve management. Central banks, particularly in the Global South, are aggressively diversifying away from the dollar to mitigate currency risk and geopolitical weaponization, evidenced by the freezing of Russian reserves in 2022 [T4]. This de-dollarization trend, combined with gold’s role as a long-term store of value and inflation hedge, provides a structural demand floor that supports prices even during periods of short-term volatility.Bullish Drivers
The primary bullish catalyst is the unprecedented commitment from the official sector. A record 45% of central banks plan to increase their gold holdings over the next 12 months, with 89% expecting global reserves to grow [T2][T5]. This demand is structural rather than cyclical, as evidenced by the fact that 90% of respondents cited gold’s performance during times of crisis as a major reason for holding the metal [T2]. Additionally, gold ETFs saw $19 billion in inflows in January 2026, pushing total AUM to a record $669 billion, signaling institutional capital is rotating into the metal [T4]. The flattening Euro yield curve and the prospect of Fed rate cuts further reduce the opportunity cost of holding non-yielding gold.Relative Positioning vs Bitcoin and Ethereum
Gold and Bitcoin are increasingly decoupling in their market behavior. Gold is behaving as a strategic safe haven and reserve asset, tracking toward Goldman Sachs’ year-end target of $4,900 per ounce [T4]. In contrast, Bitcoin is trading significantly off its highs and is behaving as a liquidity-sensitive risk asset rather than a store of value [T4]. While Bitcoin benefits from speculative liquidity, Gold retains its premium as a sovereign diversifier. The divergence is stark, as Gold ETFs have attracted $19 billion in a single month, whereas Bitcoin’s market cap is subject to higher volatility and speculative flows.Scenario Framework
- Bullish Scenario: A pivot in Fed policy towards rate cuts combined with renewed geopolitical flare-ups in the Middle East or Eastern Europe would trigger a resurgence in safe-haven flows. This would likely push XAU/EUR back toward its all-time high of approximately 5,385 EUR.
- Base Case: The market consolidates around current levels. A weaker EUR provides support to the EUR-denominated price, while the flattening Euro yield curve supports the real yield narrative. Expect XAU/EUR to trade in a range between 3,500 and 3,800 EUR.
- Bearish Scenario: Strong U.S. jobs data leads to sustained rate hike expectations, strengthening the USD and pushing real yields higher. This would likely force XAU/EUR to test the 200-day moving average and potentially break down toward 3,000 EUR.
Valuation Discussion
Current XAU/EUR prices at 3,618.79 represent a 25% drawdown from the January 2026 USD ATH. While this correction reflects short-term pressure from a stronger dollar and positive equity risk sentiment, the valuation is attractive relative to the fundamental demand drivers. The structural demand floor provided by central bank buying, which has averaged 1,000 tonnes annually for four years, suggests that the current price level offers a compelling entry point for strategic buyers looking to capitalize on the long-term reserve asset shift.Risks
The primary risk to the bullish thesis is a resurgence in U.S. monetary tightening. Strong U.S. jobs data has recently lifted rate-hike bets, which could strengthen the dollar and push gold below its 200-day moving average [T6]. Additionally, the emergence of China bonds as a surprise haven during the Iran war highlights competition for yield in a low-interest-rate environment [T7]. Finally, while central bank buying is robust, Metals Focus predicts a 15% year-on-year decline in tonnage terms for 2026, which could dampen the pace of price appreciation if demand slows.Appendix
Sources
- Central banks are bringing gold reserves home as geopolitical risks rise – CNBC [T1]
- Record 45% of central banks plan to increase gold holdings, WGC survey finds – KITCO [T2]
- Record 45% of central banks plan to increase gold holdings, WGC survey finds – Shanghai Metals Market [T3]
- Gold, Bitcoin, And The New Safe-Haven Playbook – Forbes [T4]
- More central banks signal plans to increase gold holdings, WGC survey shows – Reuters [T5]
- Gold’s record rally falters as bulls run into Fed rate expectations, stronger dollar – KITCO [T6]
- China bonds emerge as surprise haven as Iran war reshapes portfolios – Reuters [T7]
This report is AI-generated for informational purposes only and does not constitute financial advice. The views expressed herein are those of the author and do not reflect the official policy or position of any agency, employer, or company.
Important Note / Wichtiger Hinweis:
EN: This report may have been generated using AI. It processes data from publicly available sources. The content is provided for informational purposes only.DE: Dieser Bericht kann mithilfe von KI erstellt worden sein. Dabei werden Daten aus öffentlich zugänglichen Quellen verarbeitet. Die Inhalte dienen ausschließlich Informationszwecken.
* DE: Die ergänzenden Inhalte können KI-generiert sein. EN: The additional content may be AI-generated.