
Listen to the summary
Key Data Snapshot
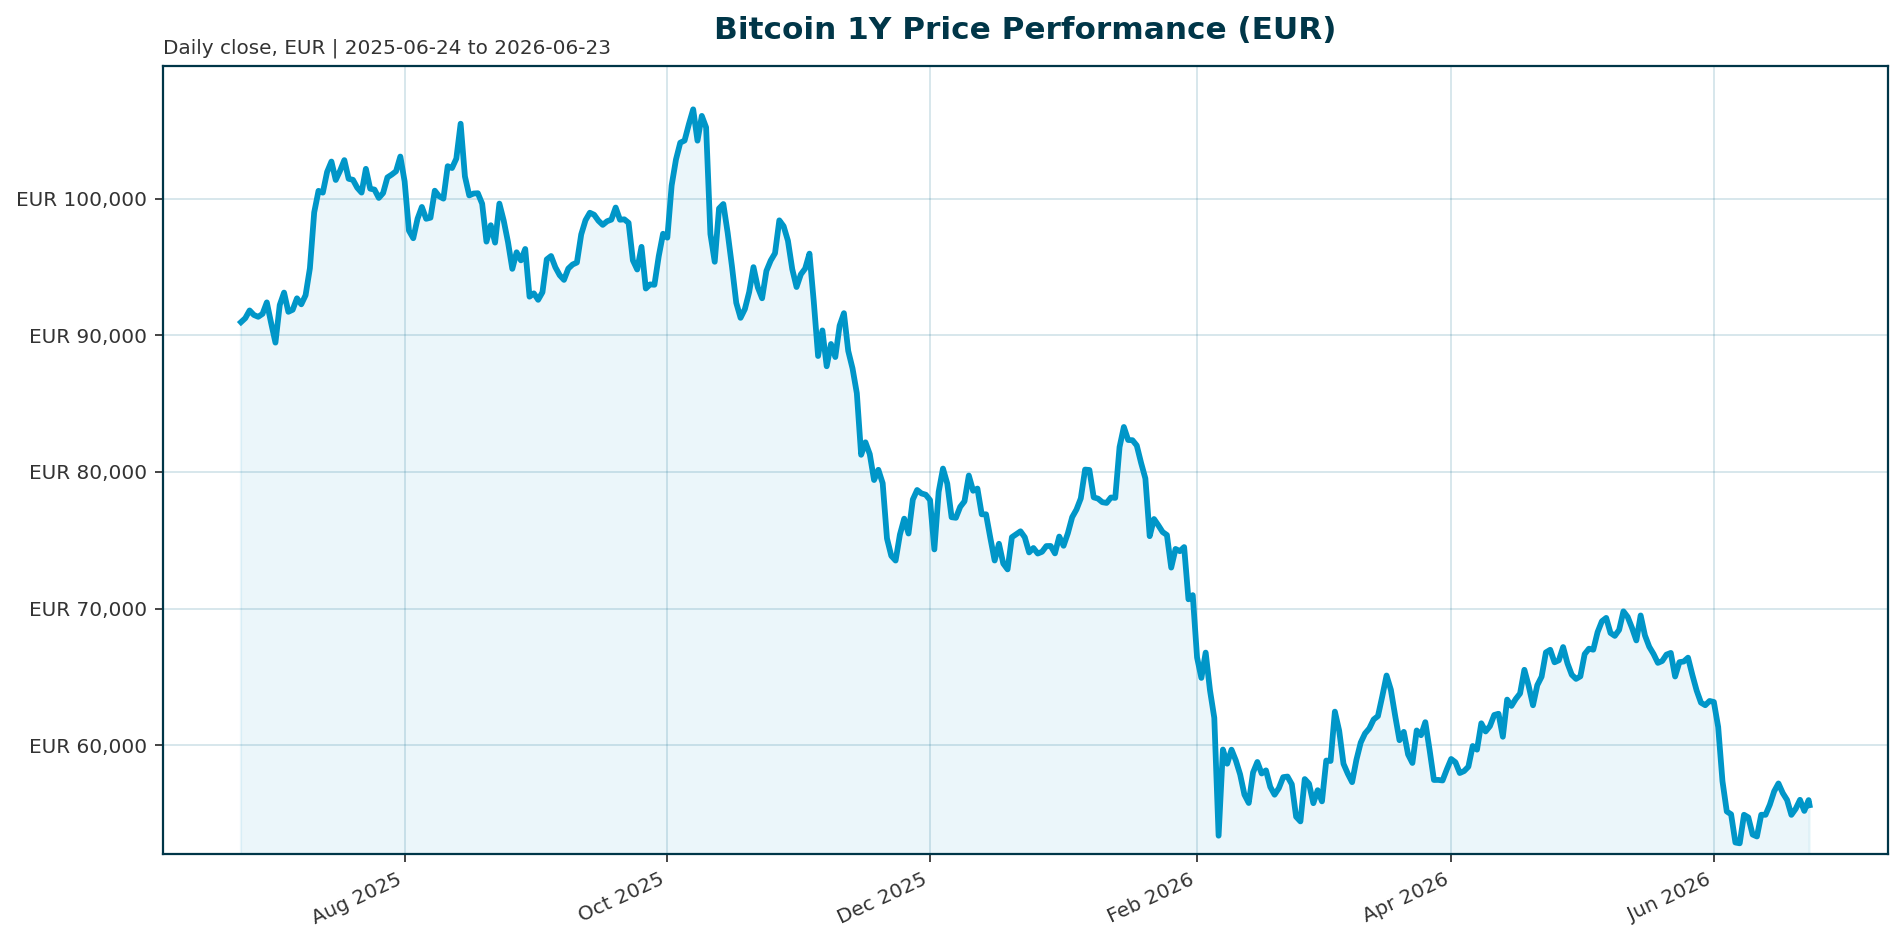
Bitcoin trades at 55,651 EUR, representing a 36.76% year-to-date decline from the October 2025 all-time high of 107,662 EUR. The market cap stands at 1.12 trillion EUR, with circulating supply at 20,046,693 BTC. Spot ETFs now hold 1.75 million BTC, a significant increase from 635,000 at the start of 2024, signaling sustained institutional interest despite recent volatility.
| Metric | Value |
|---|---|
| Current Price (EUR) | 55,651.00 |
| Market Cap (EUR) | 1.12T |
| All-Time High (ATH) | 107,662.00 (Oct 2025) |
| ATH Change | -48.31% |
| 200-Day Change | -29.77% |
| ETF Holdings | 1.75M BTC |
Calculation: Current price is approximately 51.7% of the ATH. Market cap per BTC is ~55,650 EUR.
Market Setup
Risk sentiment remains neutral as global equity markets display divergent performance. The DAX leads regional gains with a 5-day rise of 0.92%, while the Hang Seng lags with a 5-day decline of 4.14%. The Euro area AAA 10-year yield sits at 3.04%, offering mixed support for risk assets. The FX backdrop is mixed, with EUR/CHF showing strength while EUR/USD remains under pressure. Key observations indicate that DACH equities are outperforming global peers, suggesting a selective risk-on environment that contrasts with Bitcoin’s current behavior as a high-beta asset.
Investment Thesis
The core investment thesis for Bitcoin centers on the maturation of its institutional ownership base. While spot ETFs have successfully brought in capital, the current ownership structure treats Bitcoin primarily as a growth and speculative allocation rather than a monetary hedge. The long-term thesis relies on the potential for Bitcoin to become the base layer for emerging blockchain infrastructure, a narrative bolstered by the stalled but critical Clarity Act in Washington [T4]. Until the ownership base matures further through corporate treasury adoption and sovereign wealth fund allocations, price action will likely remain correlated with broader risk assets.
Bullish Drivers
- ETF Resilience: BlackRock’s IBIT ETF has demonstrated demand resilience, adding over 150 million in a four-day stretch, suggesting that the worst of the recent outflows may be easing [T5].
- On-Chain Accumulation: High-net-worth individuals and corporations continue to accumulate, evidenced by Cardone increasing his holdings by 282 BTC over the weekend [T3].
- Liquidity Signals: Bitcoin’s order book on Binance is flashing a bullish signal, with buy-side liquidity surging to levels not seen since February 2024 [T5].
- Regulatory Clarity: The Clarity Act represents a pivotal catalyst. If passed by the end of summer, it would categorize digital assets and potentially unlock massive sovereign wealth fund flows [T4].
Relative Positioning vs Gold and Ethereum
Bitcoin currently faces stiff competition from gold, which is recording record-breaking demand. The World Gold Council reported central bank purchases of 244 tonnes in Q1 2026, a 2% increase year-over-year, pushing gold ETF AUM to a record 669 billion [T1]. In this environment, Bitcoin has failed its safe-haven stress test, behaving as a high-beta risk asset rather than a monetary hedge during recent market shocks [T1]. While Ethereum offers programmable capabilities, Bitcoin’s dominant position as an industry-wide vault remains its primary value proposition, though it currently lacks the structural demand floor that gold enjoys.
Scenario Framework
- Base Case: Bitcoin consolidates between 50,000 and 60,000 EUR. ETF outflows slow as IBIT maintains a foothold, and the market waits for regulatory clarity or macro stability.
- Bull Case: The Clarity Act passes, removing regulatory uncertainty. Combined with a stable Fed policy regime, Bitcoin breaks the 60,000 EUR resistance level, targeting 70,000 EUR.
- Bear Case: Geopolitical tensions, such as the Iran nuclear talks, trigger a global risk-off event. Bitcoin breaks below the 60,000 support range, with traders eyeing 45,000 as the next downside target [T2].
Valuation Discussion
Bitcoin is currently trading at approximately 52% of its all-time high, reflecting a deep correction phase. The 200-day decline of nearly 30% indicates a secular bear market phase. However, the market cap of 1.12 trillion EUR provides a structural floor supported by ETF holdings. Valuation is currently driven by liquidity flows rather than intrinsic value, making the asset highly sensitive to macro risk sentiment and regulatory news.
Risks
- Safe Haven Failure: The empirical data in 2026 challenges the narrative that Bitcoin is a store of value, as it correlated negatively with traditional assets during stress events [T1].
- Regulatory Stagnation: The stalled progress of the Clarity Act leaves a regulatory overhang that could suppress institutional entry rates [T4].
- Self-Custody Erosion: Growing reliance on ETFs threatens the core principle of self-custody, potentially alienating purist holders and creating counterparty risks [T6].
- Macro Headwinds: Elevated Euro area yields at 3.04% could continue to pressure risk assets, particularly if inflation data remains sticky.
Appendix
Sources:
- Gold, Bitcoin, And The New Safe-Haven Playbook – Forbes [T1]
- Bitcoin falls below $63,000 as risk assets sell off and the week’s bounce fades – CoinDesk [T2]
- Cardone has increased his holdings by 282 BTC, while Bitdeer insists on a “zero holding” fiat operation – WEEX [T3]
- The Trump Administration Wants the Clarity Act Passed By the End of Summer. 3 Cryptocurrencies to Buy Now. – The Motley Fool [T4]
- Live updates: Bitcoin bottom signal flashes as holders absorbed 125,000 BTC in June – CoinDesk [T5]
- Bitcoin ETFs Risk Eroding Self-Custody, Trezor Warns – CoinMarketCap [T6]
- Robinhood Reduces Workforce 10% While Pledging to Keep Hiring – BeInCrypto [T7]
- Investors can buy duration safely as Fed will remain on hold, says Allspring’s George Bory – CNBC [T8]
This report is AI-generated for informational purposes only and does not constitute investment advice. Readers should conduct their own due diligence before making investment decisions.
Important Note / Wichtiger Hinweis:
EN: This report may have been generated using AI. It processes data from publicly available sources. The content is provided for informational purposes only.DE: Dieser Bericht kann mithilfe von KI erstellt worden sein. Dabei werden Daten aus öffentlich zugänglichen Quellen verarbeitet. Die Inhalte dienen ausschließlich Informationszwecken.
* DE: Die ergänzenden Inhalte können KI-generiert sein. EN: The additional content may be AI-generated.