
Listen to the summary
Key Data Snapshot
| Metric | Value |
|---|---|
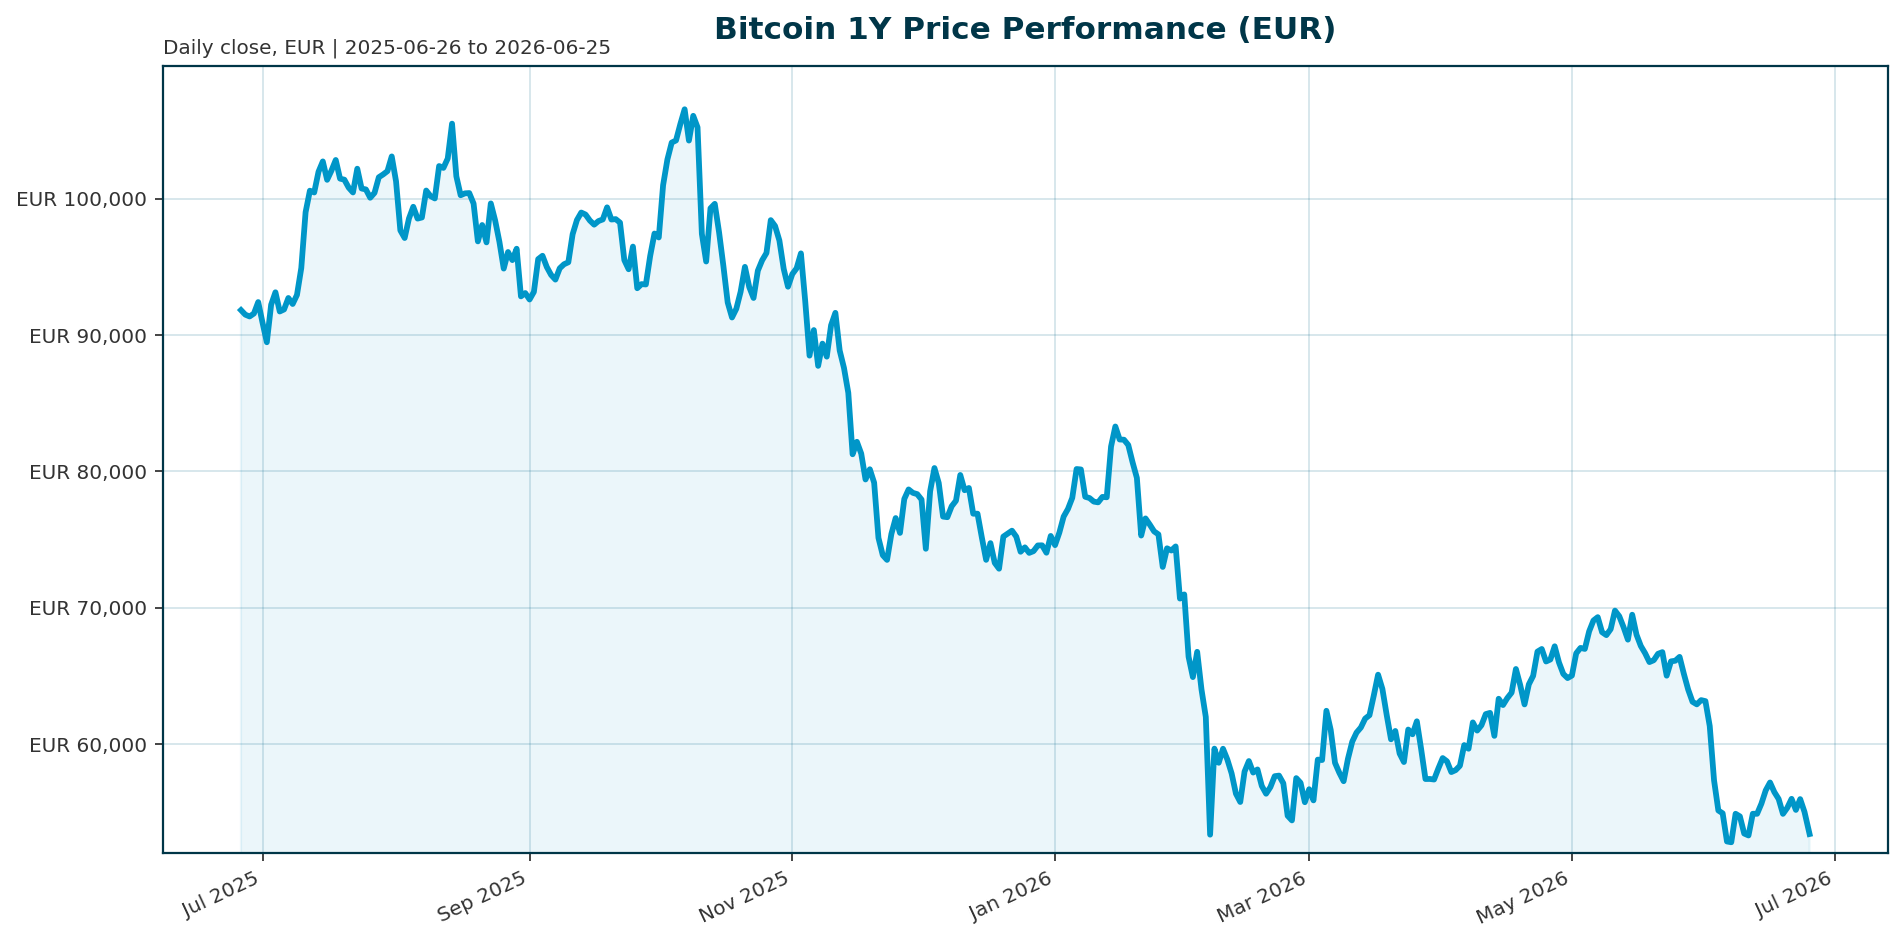
| Price (EUR) | 53,433.00 |
| 24h Change | -2.97% |
| 30d Change | -18.82% |
| 1y Change | -41.74% |
| ATH (EUR) | 107,662.00 |
| ATH Drawdown | -50.37% |
| Market Cap (EUR) | 1.07T |
| 55.95% | |
| 24h Volume (EUR) | 36.29B |
| High (24h) | 55,434.00 |
| Low (24h) | 52,124.00 |
Market Setup
Risk sentiment is neutral to negative with a broader equity market correction pressuring risk assets. The Euro area 10Y yield sits at 2.97% with mixed yield movements, while the Euro is broadly weaker against the USD and CHF. Key observations indicate Nikkei 225 leads on a 1-month basis at 10.86%, whereas Hang Seng is the weakest performer at -3.56%. The DAX and Nasdaq Composite are both down over 5 days, with the Nasdaq falling 2.09%. In the crypto-specific environment, sentiment weakened as the U.S. dollar strengthened and rate expectations shifted. Investors are closely monitoring exchange-traded fund flows, which have been mostly outflows, alongside regulation and macro conditions [T1].Investment Thesis
Bitcoin serves as the base layer for emerging blockchain infrastructure, functioning like an industrywide vault with high dominance. Institutional investment continues to build, adding legitimacy and price stability to the asset class despite volatility. The current cycle diverges from historical patterns because spot ETFs were approved just before the 2024 halving. This structural shift pulled in institutional demand that did not exist previously, redirecting speculative energy from altcoins into spot ETF vehicles [T2][T4]. Long-term holders view Bitcoin as an inflation hedge, created in response to the 2008 government bailouts, positioning it as a counter to potential future money printing [T8].Bullish Drivers
Regulatory clarity represents a primary catalyst, with the Trump Administration pushing the Clarity Act to categorize digital assets and set regulatory boundaries before summer [T4]. Institutional conviction remains evident despite short-term outflows, as public entities like Cardone increased holdings by 282 BTC [T3]. ETF investors are largely holding onto their positions despite uncertainty, indicating a willingness to buy through initial downdrafts [T5]. Additionally, some analysts posit that an implosion of the AI bubble and subsequent money printing could drive Bitcoin to $1 million, viewing current volatility as a precursor to a major inflation hedge demand [T8].Relative Positioning vs Gold and Ethereum
Bitcoin currently trades at a significant discount to its ATH, down 50.37% from the October 2025 peak. Relative to Ethereum, Bitcoin maintains dominance at 55.95%, while Ethereum trades under $1,570 USD, significantly lagging behind BTC’s price action [T1]. The market is currently in a risk-off phase where BTC is de-risking alongside equities, though the structural shift toward institutional ETFs suggests a divergence in future performance compared to previous cycles where altcoins led rallies [T2].Scenario Framework
Bullish Scenario: A break above the critical $59,000 to $60,000 range triggers a reversal. If the Clarity Act passes and ETF inflows resume, Bitcoin could reclaim its ATH and target higher levels. Base Case: Bitcoin consolidates between 50,000 and 60,000 EUR. ETF outflows normalize and macro conditions stabilize, preventing a deeper breakdown. Bearish Scenario: Failure to hold the $59,000 support leads to a deeper downturn. Traders eye $45,000 as a potential downside target. Contagion from Strategy’s liquidity crunch could exacerbate the selloff [T2][T7][T8].Valuation Discussion
Bitcoin is currently priced for significant risk-off, trading 50.37% below its all-time high. The market is discounting regulatory uncertainty and macro headwinds. With spot ETFs holding 1.75 million BTC, the asset is integrating into traditional portfolios, potentially supporting a higher floor than previous cycles. However, the current drawdown of 18.8% over the last 30 days suggests the market is still pricing in the “implosion” of speculative leverage and corporate balance sheet risks [T4][T7][T8].Risks
Liquidity Contagion: Strategy’s stretch preferred stock has dropped to $88, raising concerns about the “house of cards” structure of its leverage. A collapse could trigger forced liquidations and pressure Bitcoin prices [T8]. Regulatory Headwinds: Binance faces a potential rejection of its MiCA license by Greece’s regulator, which could restrict access to the EU market [T6]. Macro Volatility: The market remains sensitive to AI spending doubts, Fed commentary, and geopolitical tensions such as the Iran nuclear program [T1][T2].Appendix
Sources
- 5 Market Signals Reveal How AI Stocks, Oil and Bitcoin Shook Wall Street – Bitcoin News [T1]
- Bitcoin falls below $63,000 as risk assets sell off and the week’s bounce fades – CoinDesk [T2]
- Cardone has increased his holdings by 282 BTC, while Bitdeer insists on a “zero holding” fiat operation – WEEX [T3]
- The Trump Administration Wants the Clarity Act Passed By the End of Summer. 3 Cryptocurrencies to Buy Now. – The Motley Fool [T4]
- Bitcoin’s future as revolutionary as the smartphone, according to CoinDesk – CNBC [T5]
- Crypto SWOT: Prediction markets have experienced a surge in activity during the FIFA World Cup – KITCO [T6]
- Bitcoin crashes, odds turn darker as MSTR, APLD lead crypto-stocks bloodbath – Seeking Alpha [T7]
- ‘House Of Cards Collapsing’ — Serious Bitcoin Crash Warning Hits Price – Forbes [T8]
Disclaimer: This report is AI-generated for informational purposes only and does not constitute investment advice. All data is based on information available as of June 25, 2026. Readers should conduct their own due diligence before making investment decisions.
Important Note / Wichtiger Hinweis:
EN: This report may have been generated using AI. It processes data from publicly available sources. The content is provided for informational purposes only.DE: Dieser Bericht kann mithilfe von KI erstellt worden sein. Dabei werden Daten aus öffentlich zugänglichen Quellen verarbeitet. Die Inhalte dienen ausschließlich Informationszwecken.
* DE: Die ergänzenden Inhalte können KI-generiert sein. EN: The additional content may be AI-generated.