
Listen to the summary
Key Data Snapshot
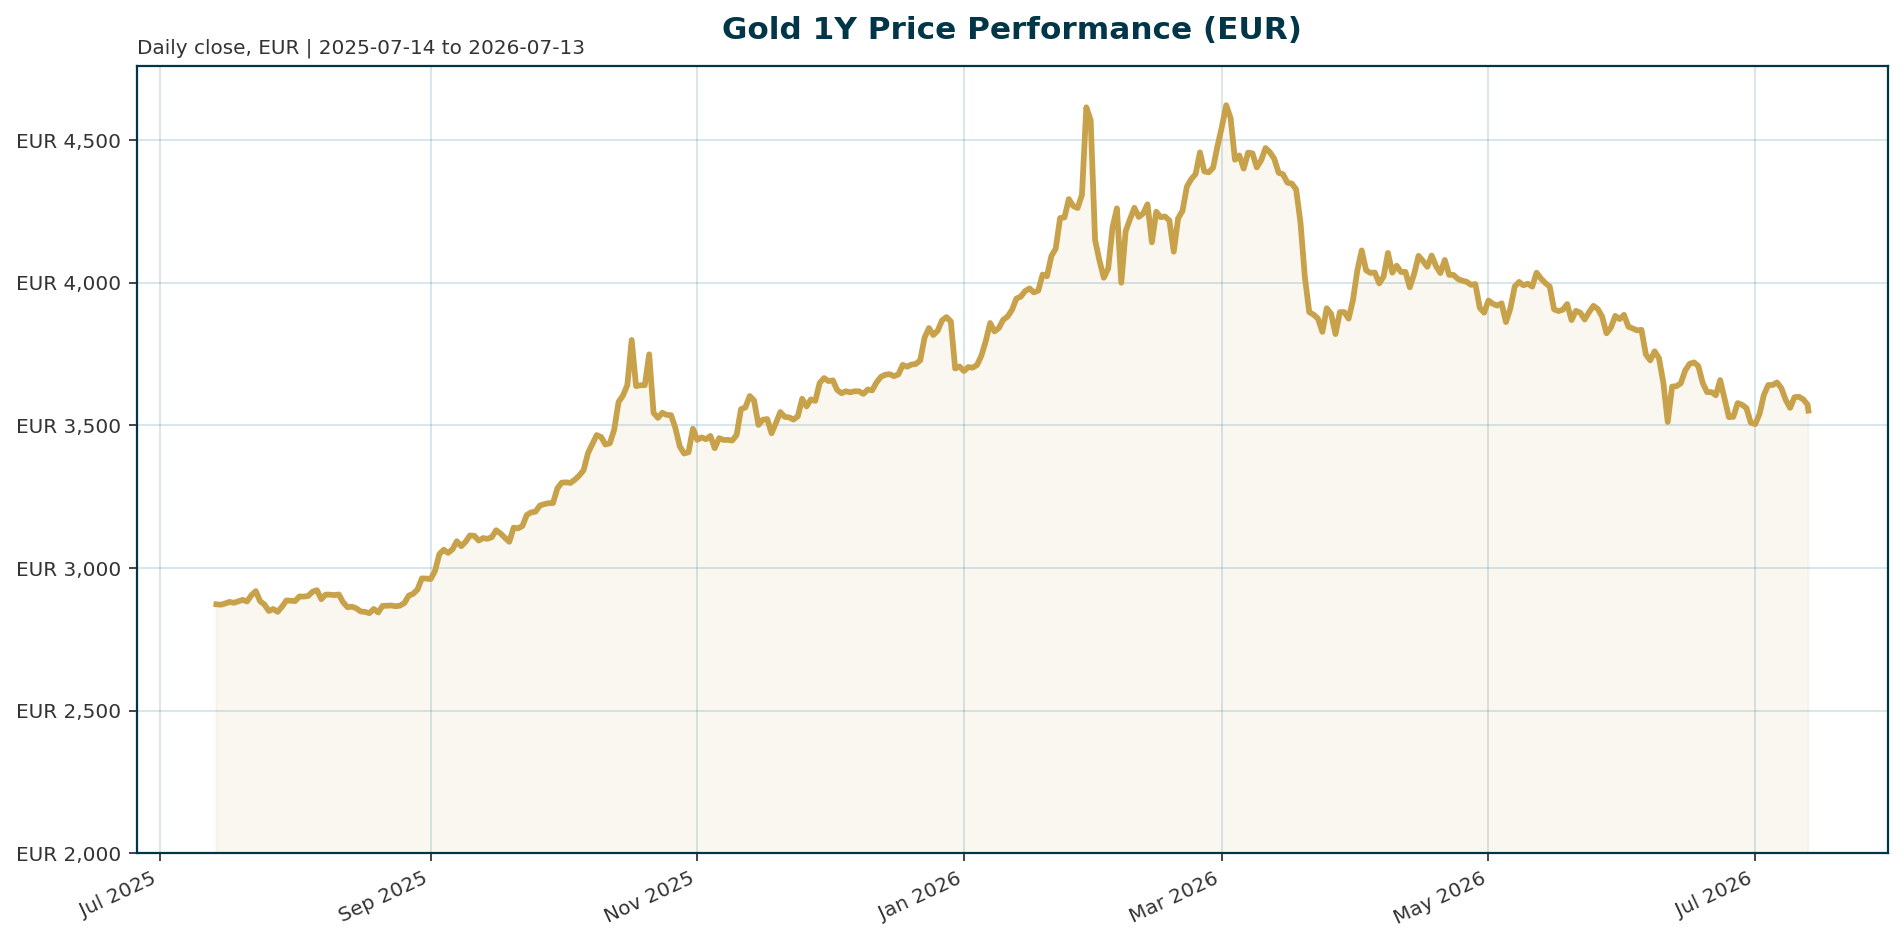
| Metric | Value | Context |
|---|---|---|
| Spot Price (EUR) | 3,551.63 | Down 1.12% over 24 hours |
| All-Time High | 4,688.32 | Set Jan 29, 2026. Current price is -24.15% below ATH |
| 200-Day Return | -6.86% | Indicates a significant correction phase |
| Euro Area 10Y Yield | 3.13% | Rising 12.3 basis points over 5 days |
| Central Bank Net Buy (May) | 41 tonnes | Record 45% of central banks plan to increase reserves [T1][T2] |
| BTC Dominance | 56.045% | High level suggests competition for reserve status |
Macro Backdrop
Risk sentiment is neutral to positive while euro area yields are rising. Euro area AAA 10Y yield sits at 3.13%, moving 12.3 basis points higher over five days. FX markets are mixed with EUR/USD at 1.1435. Key observations show Hang Seng leading global equities at 2.53% while DAX lags at -2.91%, indicating a divergence in regional performance. This mixed environment creates a challenging environment for non-yielding assets like gold.
Investment Thesis
Gold is navigating a bifurcated macro environment defined by a conflict between cyclical headwinds and structural tailwinds. The cyclical case is challenged by rising real bond yields stemming from sticky inflation and Fed tightening signals, which increase the opportunity cost of holding the metal. Conversely, the structural case remains robust as central banks prioritize gold for portfolio diversification against geopolitical fragmentation and fiscal dominance. The investment thesis posits that structural demand from sovereign balance sheets will eventually outweigh the short-term drag from higher rates, supporting a long-term bullish outlook.
Bullish Drivers
- Central Bank Accumulation: A record 45% of central banks plan to increase gold reserves over the next 12 months, with Poland and China leading purchases despite price declines [T1][T2][T5][T6]. This sovereign demand acts as a strong floor for prices.
- Geopolitical Risk: The ongoing energy crisis and war with Iran are keeping inflation expectations elevated, reinforcing gold’s role as a hedge against currency debasement and purchasing power erosion [T1][T3].
- Supply Dynamics: Russia has sold gold during ten of the past 12 months, potentially reducing selling pressure on the market [T7].
Relative Positioning vs Bitcoin and Ethereum
Gold maintains its status as the primary reserve asset benchmark, distinct from the high-beta nature of cryptocurrencies. However, Bitcoin dominance at 56.045% highlights the growing narrative competition for the “digital gold” title. While gold benefits from institutional rotation during risk-off periods, Bitcoin often acts as a risk-on asset. The correlation between gold and crypto remains a critical variable for portfolio allocation, as a shift in risk appetite could see capital rotate out of gold into digital assets.
Scenario Framework
- Bullish Scenario: The Federal Reserve signals a pivot to easing as inflation pressures ease, causing real yields to peak and fall. Central bank buying accelerates. Gold targets 4,000 to 4,200 EUR.
- Bearish Scenario: Real yields remain elevated due to persistent core inflation, and the Fed maintains a hawkish stance. Continued ETF outflows exacerbate the correction. Gold targets 3,000 to 3,200 EUR.
- Base Case: Central bank buying offsets rate headwinds. Gold consolidates between 3,200 and 3,800 EUR while waiting for clearer policy signals.
Valuation Discussion
Gold is currently trading at a 24.15% discount to its January 2026 all-time high. This compression is largely driven by the spike in real yields. Valuation metrics suggest the metal is undervalued relative to its long-term reserve asset utility, but overvalued relative to current yield environments. The 200-day return of -6.86% indicates a significant correction phase is underway. Investors are currently pricing in the cyclical headwinds more aggressively than the structural tailwinds.
Risks
- ETF Outflows: Investors sold approximately 2.1 million ounces during June, helping to explain the recent price decline [T7]. Continued selling could exacerbate the correction.
- Real Yield Spike: If real bond yields continue rising due to sticky inflation, the opportunity cost of holding gold will increase, pressuring prices further [T1][T3].
- Risk-On Rotation: Strength in global equities, particularly the Hang Seng, could trigger a rotation out of safe havens as investors seek higher yields in riskier assets [market_overview].
Appendix
Sources
- Poland’s central bank is buying the dip as gold’s biggest buyers aren’t backing down – KITCO [T1]
- Central banks are voting for gold with their balance sheets – KITCO [T2]
- Have metals bottomed, and have yields peaked? Monetary and fiscal policies will determine both – CME’s Norland – KITCO [T3]
- Gold price may have found its floor as liquidation gives way to consolidation – Saxo Bank – Bitget [T4]
- China gold reserves rise most since 2023 even as bullion tumbles – KITCO [T5]
- China’s top ETF is now gold, not stocks – Mining.com [T6]
- Gold and silver WARNING: The selling is not over – KITCO [T7]
- Fed’s Perli reiterates flexible path of reserve management buying – KITCO [T8]
Disclaimer: This report is AI-generated for informational purposes only and does not constitute investment advice. The analysis is based on data available as of the date of generation and may not reflect real-time market conditions.
Important Note / Wichtiger Hinweis:
EN: This report may have been generated using AI. It processes data from publicly available sources. The content is provided for informational purposes only.DE: Dieser Bericht kann mithilfe von KI erstellt worden sein. Dabei werden Daten aus öffentlich zugänglichen Quellen verarbeitet. Die Inhalte dienen ausschließlich Informationszwecken.
* DE: Die ergänzenden Inhalte können KI-generiert sein. EN: The additional content may be AI-generated.