
Listen to the summary
Key Data Snapshot
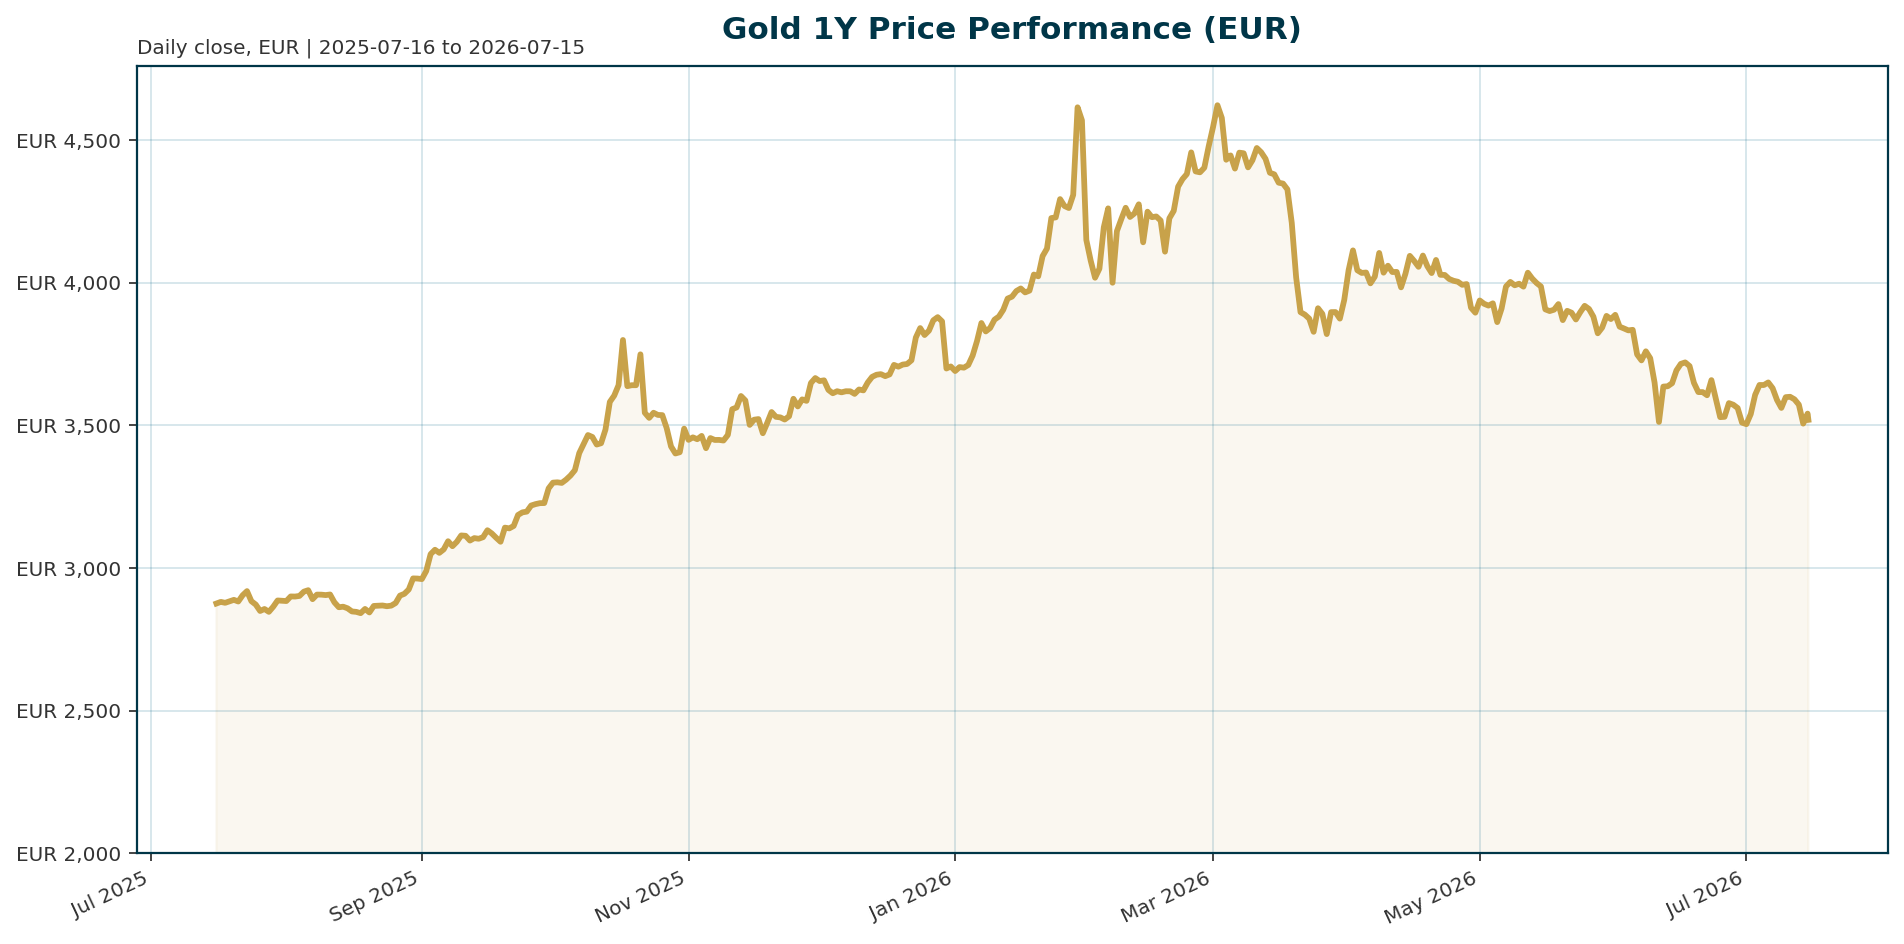
| Indicator | Value | Context |
|---|---|---|
| Gold Price (XAU/EUR) | 3,519.58 | Current spot price |
| All-Time High (ATH) | 4,688.32 | Jan 29, 2026; Drawdown: 25.0% |
| 1-Year Return | +22.50% | Strong long-term performance |
| 30-Day Return | -5.38% | Recent correction phase |
| Euro Area 10Y Yield | 3.12% | +6.8 bp over 5 days |
| Central Bank Survey (WGC) | 45% | Plan to increase gold holdings in 12 months |
Macro Backdrop
The macro environment is defined by neutral to positive risk sentiment and mixed euro area yields. The Euro Area AAA 10Y yield stands at 3.12%, while the 2Y yield is 2.64%, creating a complex backdrop for the opportunity cost of holding non-yielding gold. FX markets are mixed with EUR/USD at 1.1423. Key observations include the Hang Seng leading regional performance at 2.60% while the S&P 500 lags at 0.81%, indicating a divergence in equity momentum between regions.Investment Thesis
The fundamental thesis for gold remains anchored in the structural shift toward a multipolar global financial system. Central banks are not buying gold to trade short-term momentum but to secure balance sheets against decades of geopolitical risk and currency volatility. The asset acts as a diversification tool independent of any single government’s fiscal or monetary policy. This long-term perspective prioritizes gold’s role as a store of value over short-term yield compression, particularly as fiscal policy remains extremely loose despite ongoing monetary tightening.Bullish Drivers
- Sovereign Accumulation: Central banks are aggressively accumulating reserves despite price weakness. Poland targets 700 tonnes (currently 632.4) and China has purchased for 20 consecutive months [T1][T2].
- Geopolitical Inflation: The war with Iran and energy crisis are driving persistent core inflation, which supports gold’s inflation-hedge narrative and pushes real yields higher, though central bank surveys indicate this is being viewed as a diversification opportunity rather than a selling signal [T1][T7].
- Survey Data: The World Gold Council reports a record 45% of central banks plan to increase holdings, while OMFIF surveys show over 60% expect prices between $5,000 and $6,000 over the next year [T1][T2].
- Fed Flexibility: Fed comments suggest a flexible path for reserve management purchases, implying potential support for liquidity conditions if money markets tighten [T6].
Relative Positioning vs Bitcoin and Ethereum
Gold is currently exhibiting decoupling behavior from traditional tech assets. While Bitcoin dominance remains high at 56.34%, gold is outperforming weak US equities like the S&P 500 on a 5-day basis. The rotation of speculative capital from gold into AI and growth sectors (evidenced by BMO’s largest weekly ETF outflows since 2018) contrasts with the resilience of central bank balance sheet building, positioning gold as a counterweight to the crowded AI trade [T4][T5].Scenario Framework
- Bullish Case: Central banks maintain aggressive accumulation, inflation spikes due to energy constraints, and the Fed pivots to easing. Real yields peak and then decline, removing the opportunity cost headwind. XAU/EUR targets the $5,000–$6,000 range anticipated by reserve managers [T1][T2].
- Base Case: Gold consolidates between 3,500 and 4,000 EUR. Central banks continue steady buying, while real yields stabilize. The market absorbs ETF outflows as a normal rotation phase following a strong 1-year run [T4][T5].
- Bearish Case: Real yields spike above 4% due to persistent core inflation, and the Fed maintains a tight stance. Speculative selling accelerates, and Russian reserve selling continues. XAU/EUR tests the 3,000 EUR support level [T3][T5].
Valuation Discussion
The current price of 3,519.58 EUR represents a deep discount of approximately 25% from the January 2026 ATH of 4,688.32 EUR. This drawdown creates a valuation entry point for long-term holders, particularly given central bank expectations of a $5,000–$6,000 price target. However, valuation is inversely correlated with real yields; as Euro area yields rise, the opportunity cost of holding gold increases, keeping the asset range-bound until monetary policy eases or inflation pressures force a repricing.Risks
- Opportunity Cost: Rising real yields due to persistent inflation and Fed tightening under Chairman Warsh remain the primary headwind, pressuring the non-yielding asset [T1][T3].
- Speculative Rotation: Continued ETF outflows, evidenced by 2.1 million ounces sold in June, suggest institutional and retail capital is rotating into higher-yielding or growth assets [T5].
- Russian Selling: Anecdotal evidence suggests Russia has sold gold in ten of the last 12 months, potentially adding downward pressure on prices during periods of liquidity stress [T5].
Appendix
Sources
- [T1] Poland’s central bank is buying the dip as gold’s biggest buyers aren’t backing down – KITCO
- [T2] Central banks are voting for gold with their balance sheets – KITCO
- [T3] Have metals bottomed, and have yields peaked? Monetary and fiscal policies will determine both – CME’s Norland – KITCO
- [T4] Gold SWOT: DPM Metals delivers solid Q2 production – KITCO
- [T5] Gold and silver WARNING: The selling is not over – KITCO
- [T6] Fed’s Perli reiterates flexible path of reserve management buying – KITCO
- [T7] Resilience In A Reflationary World: Navigating Concentration, Conflict, & Conviction In EM – Seeking Alpha
Disclaimer: This report is AI-generated for informational purposes only and does not constitute investment advice. The views expressed are those of the model and do not reflect the official positions of any financial institution. Readers should conduct their own due diligence before making investment decisions.
Important Note / Wichtiger Hinweis:
EN: This report may have been generated using AI. It processes data from publicly available sources. The content is provided for informational purposes only.DE: Dieser Bericht kann mithilfe von KI erstellt worden sein. Dabei werden Daten aus öffentlich zugänglichen Quellen verarbeitet. Die Inhalte dienen ausschließlich Informationszwecken.
* DE: Die ergänzenden Inhalte können KI-generiert sein. EN: The additional content may be AI-generated.