
Listen to the summary
Key Data Snapshot
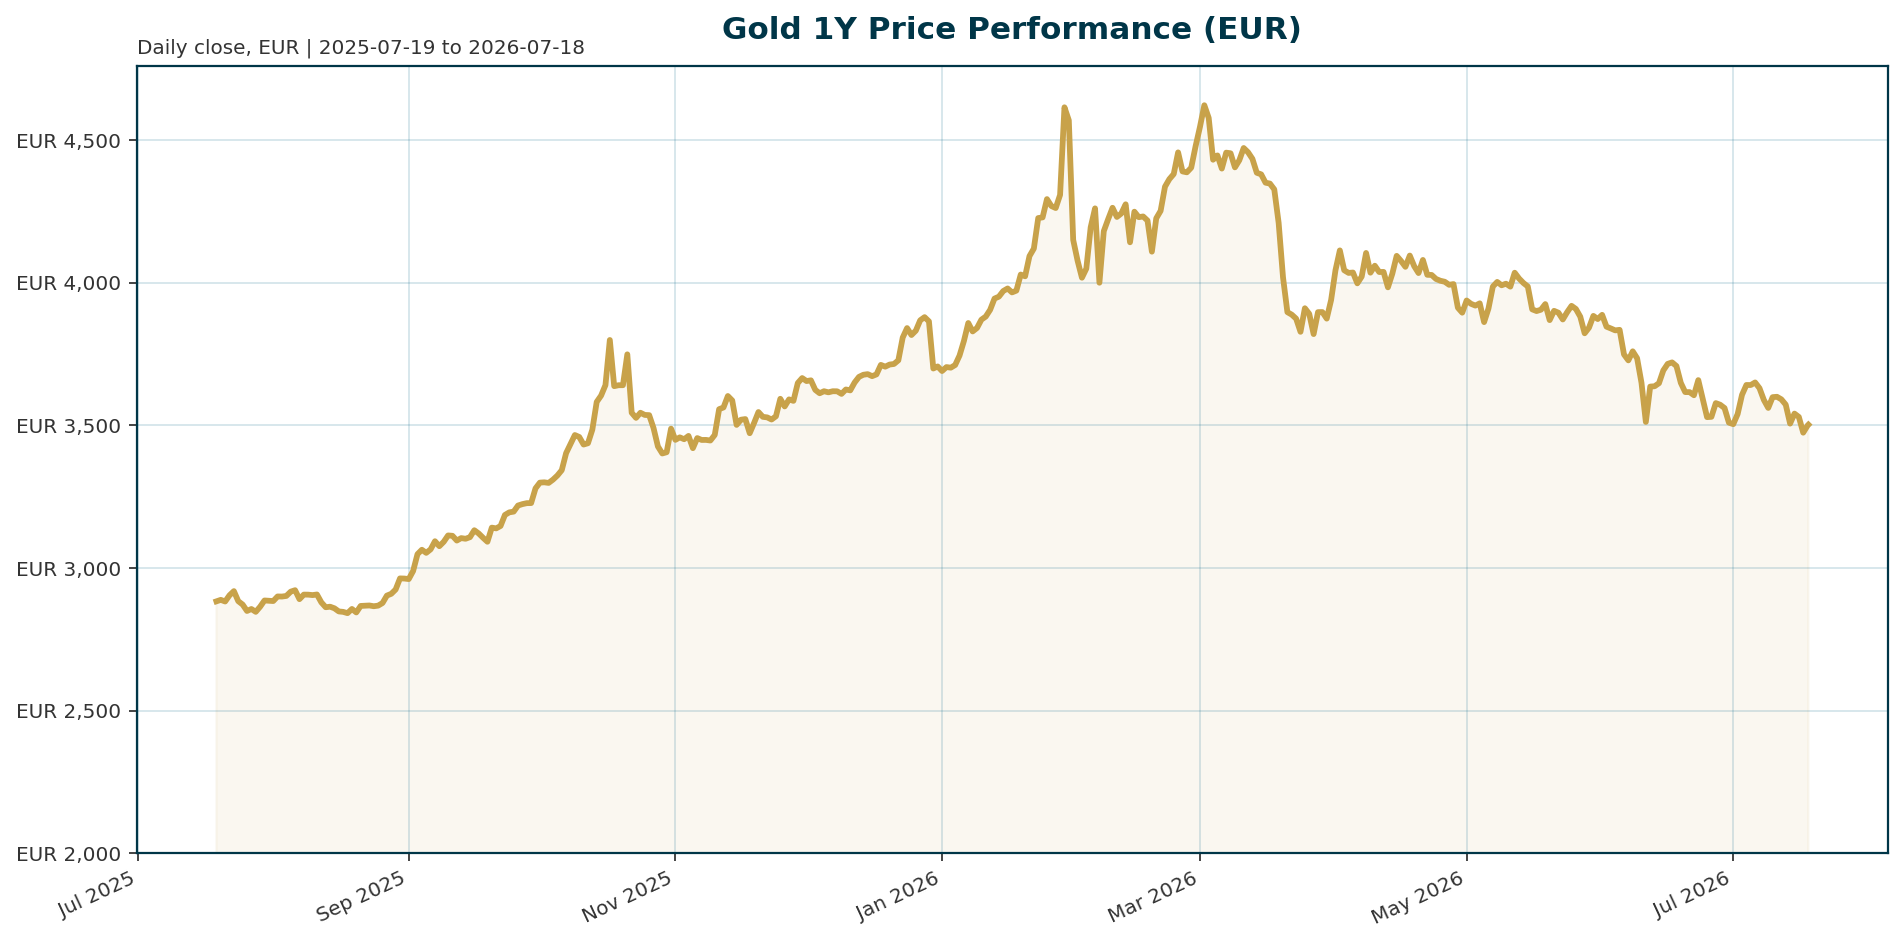
| Asset | Price (EUR) | 24h Chg | 30d Chg | 1Y Chg | ATH | ATH Drawdown |
|---|---|---|---|---|---|---|
| Gold (XAU) | 3,502.58 | +0.54% | -6.29% | +21.93% | 4,688.32 | -25.31% |
Key Macro Variables:
- Euro Area 10Y Yield: 3.18% (+6.9bp 5d)
- EUR/USD: 1.1457 (+0.29% 5d)
- BTC Dominance: 56.39%
- Central Bank Net Buys (May): 41 tonnes
Macro Backdrop
Risk sentiment remains neutral to negative as global equities struggle with mixed momentum. The DAX and Euro Stoxx 50 are down 1.1% and 0.6% over five days, respectively, while the Nikkei 225 leads the downside at -4.61%. The Hang Seng stands out as the strongest performer, gaining 1.44% over the same period [T4].
The rates backdrop is mixed. Euro area yields are edging higher, with the 10-year yield at 3.18% and the 2-year yield at 2.70%, reflecting a modest tightening bias [T4]. However, the EUR/USD pair is appreciating, currently trading at 1.1457, which provides a supportive backdrop for EUR-denominated gold [T4]. Inflation data shows signs of cooling, with June CPI at 3.5% YoY and core inflation at 2.6%, though this remains above the Fed’s target [T5].
Investment Thesis
The investment thesis for gold has shifted from a traditional inflation hedge to a “monetary hedge” and a strategic reserve asset in a new multipolar world. Gold occupies a unique position as “outside money,” carrying no political allegiance, no counterparty risk, and immunity from domestic sanctions [T1].
Structural demand is being driven by central banks diversifying away from the US dollar due to erratic US policymaking and geopolitical tensions [T2]. The Fed, under Chair Kevin Warsh, faces a difficult balancing act between political demands for easier money and economic data suggesting tighter policy. This credibility gap creates a supportive environment for non-sovereign assets like gold [T1].
Bullish Drivers
- Central Bank Accumulation: Central bank buying accelerated in May, reaching 41 tonnes, the highest since November 2025. Poland led with 18 tonnes, and China added 10 tonnes, signaling a long-term commitment to reserve diversification [T6][T7].
- Geopolitical Risk: Renewed hostilities between the US and Iran, particularly around the Strait of Hormuz, continue to stoke safe-haven demand and threaten energy supply chains [T4][T6][T8].
- Real Rate Dynamics: A prolonged “Fed on hold” environment could eventually lead to negative real rates. Analysts note that despite current volatility, consensus long-term targets for 2026 and 2027 remain elevated, averaging around $4,700 [T5].
- EUR Strength: The appreciation of the EUR against the USD supports the XAU/EUR price action, mitigating some of the headwinds from a stronger dollar [T4].
Relative Positioning vs Bitcoin and Ethereum
Capital rotation is evident in the crypto space, with Bitcoin dominance sitting at 56.39%. This high dominance suggests a rotation of speculative capital away from traditional safe havens like gold into risk-on assets. While gold has delivered a strong 1-year return of 21.93%, its recent 30-day performance of -6.29% indicates it is currently out of favor with short-term momentum traders [T7]. Gold appears to be serving as a diversifier to the high-beta growth narrative currently driving crypto markets.
Scenario Framework
- Base Case (Consolidation): Inflation continues to ease, the Fed holds rates steady, and geopolitical tensions remain elevated but contained. Gold trades in a range between 3,200 and 4,000 EUR.
- Bull Case (Breakout): A significant escalation in US-Iran tensions or a sudden pivot by the Fed to dovish policy forces real rates negative. Gold reclaims its January 2026 ATH above 4,600 EUR.
- Bear Case (Breakdown): A hawkish surprise from the Federal Reserve or a de-escalation of Gulf tensions despite sticky inflation. The USD strengthens, and gold breaks below the 3,200 EUR support level.
Valuation Discussion
Gold is currently trading at 3,502.58 EUR, representing a 25.3% drawdown from its January 2026 all-time high of 4,688.32 EUR. Despite this pullback, the current valuation sits significantly above the 2019 ATL of 1,265.28 EUR. The valuation is supported by the Euro area 10-year yield (3.18%) and CPI (3.5%), which suggest real yields are not yet deeply negative. Given the structural demand from central banks, the current price level may offer a favorable entry point relative to the long-term secular trend.
Risks
- ETF Outflows: Speculative investors continue to rotate out of gold, evidenced by the largest weekly ETF outflows since 2018 [T7].
- Demand Destruction: Indian demand has been severely impacted by new tariffs and a government decree restricting gold purchases, removing 40-70 tonnes of monthly demand [T3].
- Geopolitical De-escalation: A resolution to the US-Iran conflict would remove a key safe-haven premium supporting the price [T6].
- US Debt Sustainability: If US interest rates rise too high (e.g., to 8%), the debt servicing burden could force a default or a collapse in the dollar, which would paradoxically hurt gold in the short term as the system struggles [T3].
Appendix
Sources:
- Gold is becoming the reserve asset of the new multipolar world – Sprott’s Paul Wong – Shanghai Metals Market [T1]
- Fed won’t hike but hold, Warsh may have started too hawkish, and U.S. policy is driving sovereign gold demand – Natixis’ Christopher Hodge – KITCO [T2]
- Gold bugs versus mainstream narrators – KITCO [T3]
- Wall Street breaks bearish, Main Street sentiment still split after gold struggles to maintain $4,000 support amid summer doldrums – KITCO [T4]
- VanEck’s Casanova sees gold’s pullback as noise, says mining stocks remain the standout trade – KITCO [T5]
- Precious metals prices slide amid renewed Gulf strikes, Perth Mint silver bar and coin demand collapses – Heraeus – KITCO [T6]
- Gold SWOT: DPM Metals delivers solid Q2 production – KITCO [T7]
- Rate-Hike Fears and Gold’s Retreat: Mining Top 50 Shed $228 Billion in Q2 – NAI500 [T8]
Disclaimer: This report is AI-generated for informational purposes only and does not constitute investment advice. The analysis reflects the data and views available as of the current date and should not be taken as a guarantee of future performance.
Important Note / Wichtiger Hinweis:
EN: This report may have been generated using AI. It processes data from publicly available sources. The content is provided for informational purposes only.DE: Dieser Bericht kann mithilfe von KI erstellt worden sein. Dabei werden Daten aus öffentlich zugänglichen Quellen verarbeitet. Die Inhalte dienen ausschließlich Informationszwecken.
* DE: Die ergänzenden Inhalte können KI-generiert sein. EN: The additional content may be AI-generated.