
Listen to the summary
Key Data Snapshot
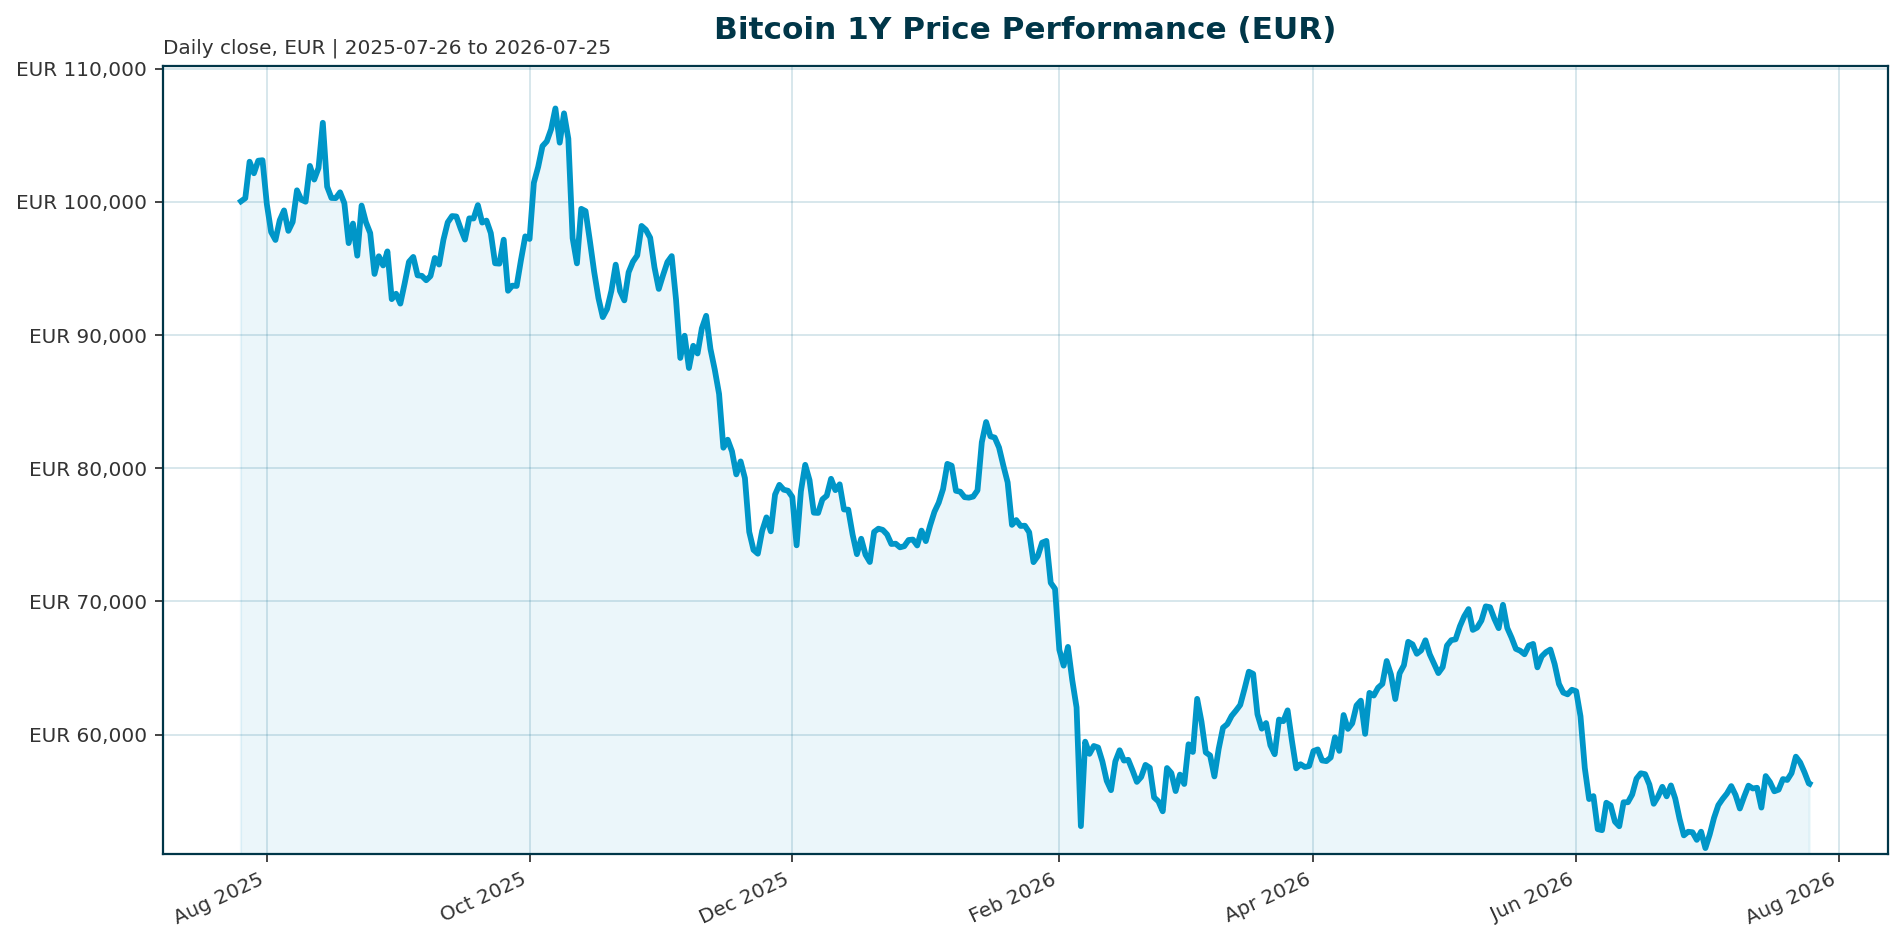
| Metric | Value |
|---|---|
| Price (EUR) | 56,319.00 |
| 24h Change | -1.6% |
| 1y Change | -45.0% |
| All-Time High (ATH) | 107,662.00 EUR |
| Market Cap | 1.13T EUR |
| Bitcoin Dominance | 56.5% |
| 24h Volume | 22.84B EUR |
Bitcoin trades at 56,319 EUR, reflecting a 47.7% discount to the October 2025 ATH of 107,662 EUR. The market shows signs of consolidation with 24-hour volume at 22.84B EUR.
Market Setup
Risk sentiment is neutral while the euro area yields are mixed. The FX backdrop is mixed with the EUR/USD at 1.1404. Key observations show the ATX leading regional equity performance with a 0.92% 5-day gain, contrasting with the Nasdaq Composite, which is the weakest major index at -2.09%. This divergence suggests a selective market environment where regional strength in DACH markets coexists with broader tech weakness.
Investment Thesis
The core thesis for Bitcoin remains its function as a non-yielding digital store of value. Analysts compare the asset to gold ETFs, noting both are wrappers around non-yielding assets where sentiment drives performance [T2]. The asset is viewed as a hedge against fiat debasement and a vehicle for portfolio diversification. Institutional innovation, such as the launch of actively managed multi-token ETFs by T. Rowe Price, reinforces the narrative of Bitcoin as a legitimate institutional asset class [T1].
Bullish Drivers
Regulatory optimism is a primary bullish catalyst. Treasury Secretary Scott Bessent indicated the Clarity Act is at the “1-yard line,” which helped drive a 2.5% rally in BTC and a 13% jump in Coinbase shares [T5]. Institutional demand continues to evolve, with T. Rowe Price launching the first active multi-token spot crypto ETF, signaling broadening access to digital assets [T1]. Technically, Bitcoin closed above a resistance level at 66,445 EUR, though daily RSI readings are overbought, suggesting potential for short-term consolidation [T6].
Relative Positioning vs Gold and Ethereum
Bitcoin dominance stands at 56.5%, indicating capital rotation into BTC from altcoins. Ethereum (ETH) has reached a local high of 1,953 EUR with an overbought RSI, while altcoin participation remains uneven [T6]. This suggests BTC is absorbing liquidity while ETH and other altcoins face resistance. The “digital gold” narrative is supported by the comparison to gold ETFs, which have grown to a 28 trillion market cap, validating the wrapper structure of Bitcoin [T2].
Scenario Framework
- Base Case (Stabilization): The Clarity Act passes, removing regulatory uncertainty. ETF outflows stabilize near zero, and Bitcoin holds the 55,000 to 60,000 EUR support zone.
- Bull Case (Rebound): Regulatory clarity is confirmed, triggering renewed institutional inflows. Bitcoin reclaims the 70,000 EUR level and tests the ATH.
- Bear Case (Correction): The Clarity Act stalls, leading to continued ETF outflows exceeding 6 billion USD this year. Bitcoin tests the 50,000 EUR support level.
Valuation Discussion
Current pricing offers a margin of safety relative to the ATH, sitting at roughly 52% below the peak. However, the valuation is pressured by approximately 5.8 billion USD in net outflows from spot ETFs this year [T1]. The fully diluted valuation matches the market cap, indicating no significant discount to potential future issuance. The asset remains expensive relative to its intrinsic cash flow, making it highly sensitive to macro shifts in real interest rates.
Risks
- Regulatory Failure: The Clarity Act could fail, leaving the asset in a regulatory grey area and halting institutional flows [T3][T5].
- Macro Headwinds: A prolonged “Fed on hold” environment with elevated real rates could pressure non-yielding assets like Bitcoin [T7].
- Institutional Flight: The record 4.5 billion USD outflow in June and continued net outflows signal that institutional demand remains cautious [T1].
- Technical Correction: Overbought technical conditions and the potential for a “shock” ETF outflow could trigger a pullback from current levels [T2][T6].
Appendix
Sources:
- [T1] Crypto SWOT: T. Rowe Price launches first active multi-token spot crypto ETF – KITCO
- [T2] Bitcoin Is Suddenly Braced For ‘Price Explosions’ As $27.9 Trillion Gold Prediction Fuels ‘Spectacular’ Bets – Forbes
- [T3] The CLARITY Act Could Be in Trouble. This is the Only Crypto I’m Buying Right Now. – The Motley Fool
- [T4] How Bitcoin Market Momentum Creates New PR Opportunities for Crypto Brands – StreetInsider
- [T5] Bitcoin Rallies After Bessent Says Clarity Act at ‘1-Yard Line’ – Bloomberg.com
- [T6] Bitcoin holds its upside case while exit signals build across the market – KITCO
- [T7] Gold’s long-term investment case is strong, and miners offer greatest upside – KITCO
This report is AI-generated for informational purposes only and does not constitute investment advice. The data and analysis provided are based on the information available at the time of generation and should not be relied upon as financial advice.
Important Note / Wichtiger Hinweis:
EN: This report may have been generated using AI. It processes data from publicly available sources. The content is provided for informational purposes only.DE: Dieser Bericht kann mithilfe von KI erstellt worden sein. Dabei werden Daten aus öffentlich zugänglichen Quellen verarbeitet. Die Inhalte dienen ausschließlich Informationszwecken.
* DE: Die ergänzenden Inhalte können KI-generiert sein. EN: The additional content may be AI-generated.