
Listen to the summary
Key Data Snapshot
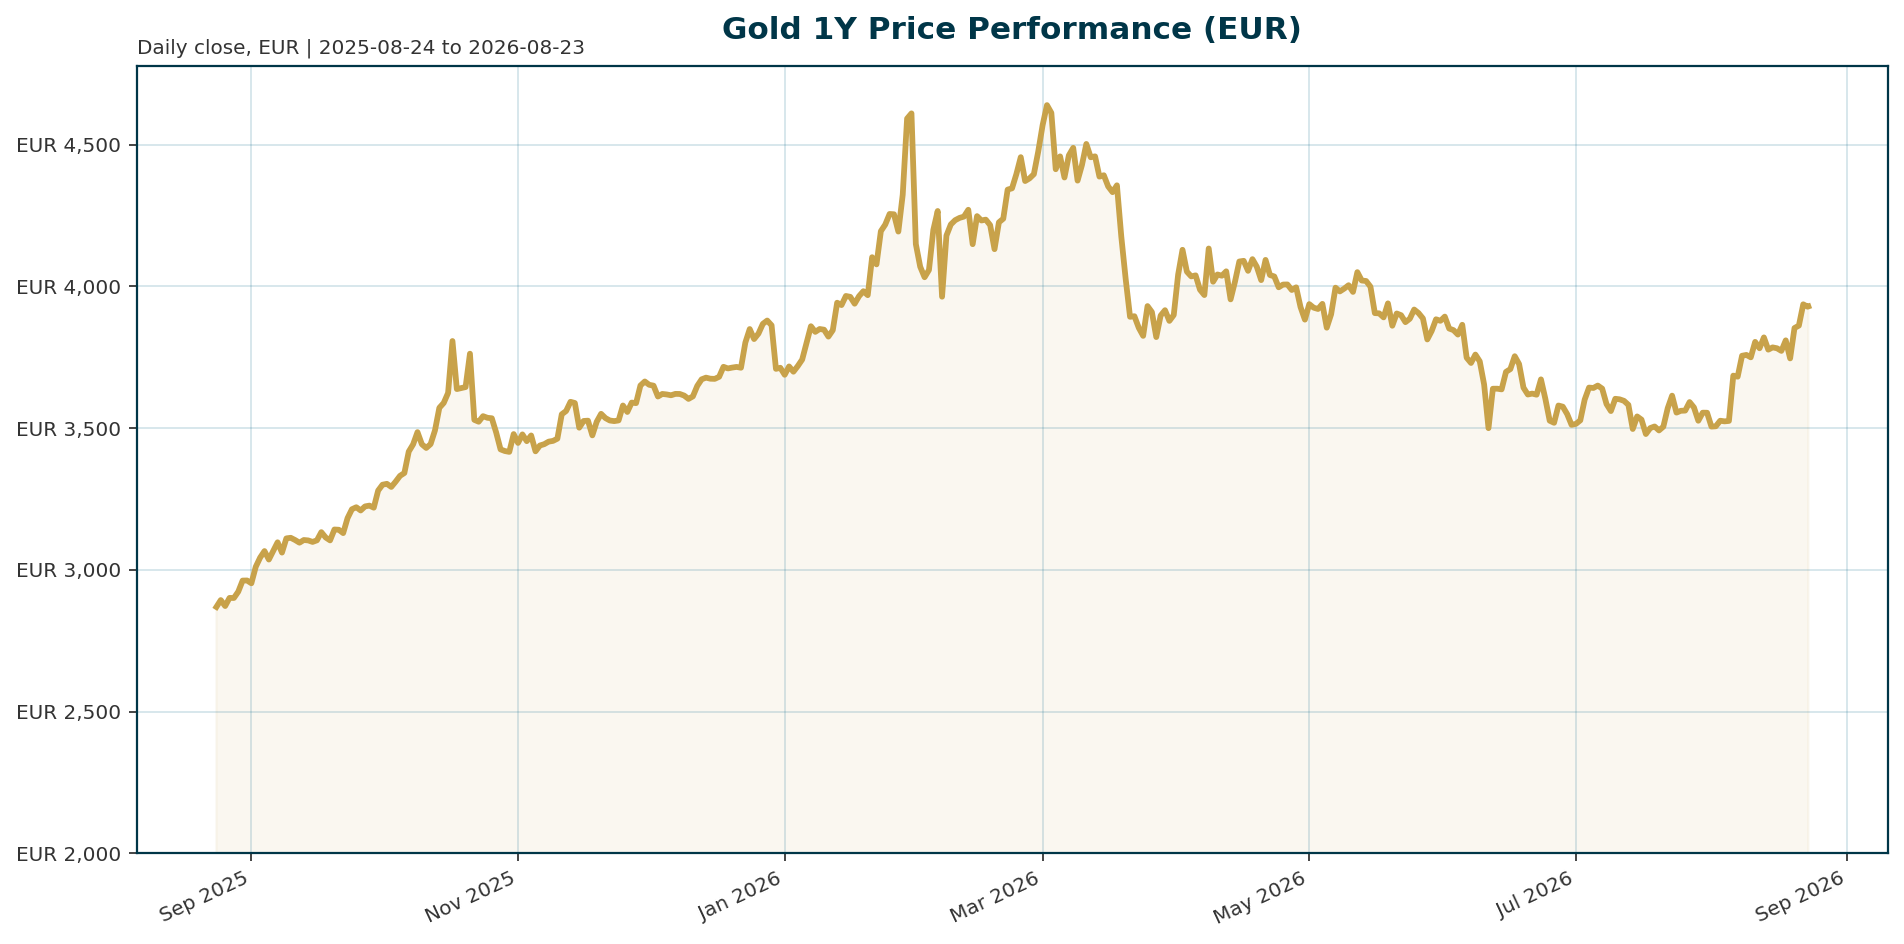
| Metric | Value | Context |
|---|---|---|
| Current Price (XAU/EUR) | 3,929.21 | Consolidating near the 24% discount level to ATH |
| 24h High / Low | 3,931.36 / 3,916.54 | Narrow trading range indicating consolidation |
| Year-to-Date (YTD) | -7.76% | Worst quarter since 2013, driven by real yield repricing |
| 1-Year Performance | +36.7% | Significant bull run entering a correction phase |
| ATH (All Time High) | 4,688.32 | >Set in Jan 2026, representing a 16.2% pullback|
| Euro Area 10Y Yield | 3.28% | >Rising 6.7bp over 5 days, increasing opportunity cost|
| EUR/USD | 1.169 | >Appreciating 0.75% over 5 days, pressuring XAU/EUR|
| BTC Dominance | 59.35% | >High dominance suggests capital rotation away from gold
Macro Backdrop
Risk sentiment is neutral with equity markets showing divergent momentum, where the Hang Seng leads with a 5-day gain of 2.19% while the Nikkei 225 lags with a decline of 4.63%. The Euro area rate backdrop is mixed, with the Euro Area AAA 10Y yield at 3.28% and rising 6.7bp over the last five days. The DAX is down 0.77% over the same period, reflecting a cautious stance. This environment suggests a “higher-for-longer” rate environment which weighs on non-yielding assets like gold, while energy price volatility complicates inflation outlooks [T1][T3].Investment Thesis
The investment thesis for gold balances short-term headwinds against long-term structural support. The current market is in a repricing phase where real yields are the dominant pricing mechanism, suppressing prices despite elevated geopolitical risks. However, the fundamental thesis remains constructive due to the structural demand from central banks and the ongoing de-dollarization trend. Gold is transitioning from a purely speculative asset to a core portfolio allocation driven by reserve diversification needs and fiscal concerns rather than just safe-haven flows [T2][T4][T5].Bullish Drivers
The primary bullish catalysts for gold are anchored in central bank behavior and potential policy shifts. A record 89% of central bank reserve managers expect to increase gold reserves over the next 12 months, driven by the need to diversify away from the US dollar and hedge against sanctions and inflation [T2][T7]. Additionally, the Federal Reserve is expected to cut rates in September and December, which would lower real yields and reduce the opportunity cost of holding gold [T1]. Persistent inflation expectations, fueled by energy price volatility, also support the asset as a hedge against currency debasement [T6].Relative Positioning vs Bitcoin and Ethereum
Gold currently faces competition for capital from the digital asset class, evidenced by Bitcoin dominance at 59.35%. This suggests a rotation of risk capital into crypto markets, which have outperformed traditional safe havens in recent cycles. However, gold retains superior institutional backing and reserve status. While crypto markets are often viewed as “get-rich-quick” vehicles, gold remains a critical component of sovereign balance sheets, offering a stable store of value that digital assets struggle to replicate during periods of systemic stress [T2].Scenario Framework
The path for gold is bifurcated based on the trajectory of US monetary policy and inflation.- Bull Case (Base): The Fed cuts rates in September and December as inflation moderates. Real yields decline below 2%, and the EUR/USD stabilizes. Gold reclaims the 4,000 EUR level.
- Bear Case: The Fed maintains a hawkish stance, keeping real yields elevated above 3%. The USD strengthens, and profit-taking accelerates. Gold tests support near 3,500 EUR.
- Stagflation Case: Energy prices spike, reigniting inflation fears. The Fed is forced to keep rates high, but gold benefits from its utility as an inflation hedge, outperforming bonds and equities.
Valuation Discussion
Gold is currently trading at a 16.2% discount to its January 2026 all-time high of 4,688.32 EUR. This pullback represents a significant margin of safety for long-term investors. The -7.76% YTD performance marks a correction phase rather than a structural breakdown, following a massive 36.7% gain over the prior 12 months. Valuation is highly sensitive to real yield levels, but the current price level offers an attractive entry point relative to the structural demand narrative supported by central banks [T3][T7].Risks
The primary downside risk is a sustained rise in real yields, which would immediately de-rate gold. A stronger US dollar, driven by hawkish Fed commentary, would exacerbate this pressure in EUR terms. Additionally, profit-taking from the 36.7% YTD rally could lead to sharper volatility than macro fundamentals suggest, particularly if the market views the current price as overextended relative to the “Golden Era” thesis [T1][T3].Appendix
Sources
- Geopolitics alone isn’t enough to lift gold | ING [T1]
- Both Gold and Silver Lose Key Support Levels! Has Last Year’s Get-Rich-Quick Myth Finally Ended? | Bitget News [T2]
- Gold suffers worst quarter in 13 years amid interest rate hike fears | CNBC [T3]
- Is it a golden era for gold? | J.P. Morgan Private Bank [T4]
- Gold, Inflation and Interest Rates: How Do They Interact? | Focus Economics [T5]
- Gold suffers worst weekly rout in 43 years – Global Times [T6]
- Gold after the correction: Recovery or further downside? | Equiti [T7]
- The relationship between gold prices and the dollar: Everything to know | CBS News [T8]
This report is AI-generated for informational purposes only and does not constitute investment advice. The views expressed are those of the model and should not be taken as financial guidance.
Important Note / Wichtiger Hinweis:
EN: This report may have been generated using AI. It processes data from publicly available sources. The content is provided for informational purposes only.DE: Dieser Bericht kann mithilfe von KI erstellt worden sein. Dabei werden Daten aus öffentlich zugänglichen Quellen verarbeitet. Die Inhalte dienen ausschließlich Informationszwecken.
* DE: Die ergänzenden Inhalte können KI-generiert sein. EN: The additional content may be AI-generated.