
Listen to the summary
Key Data Snapshot
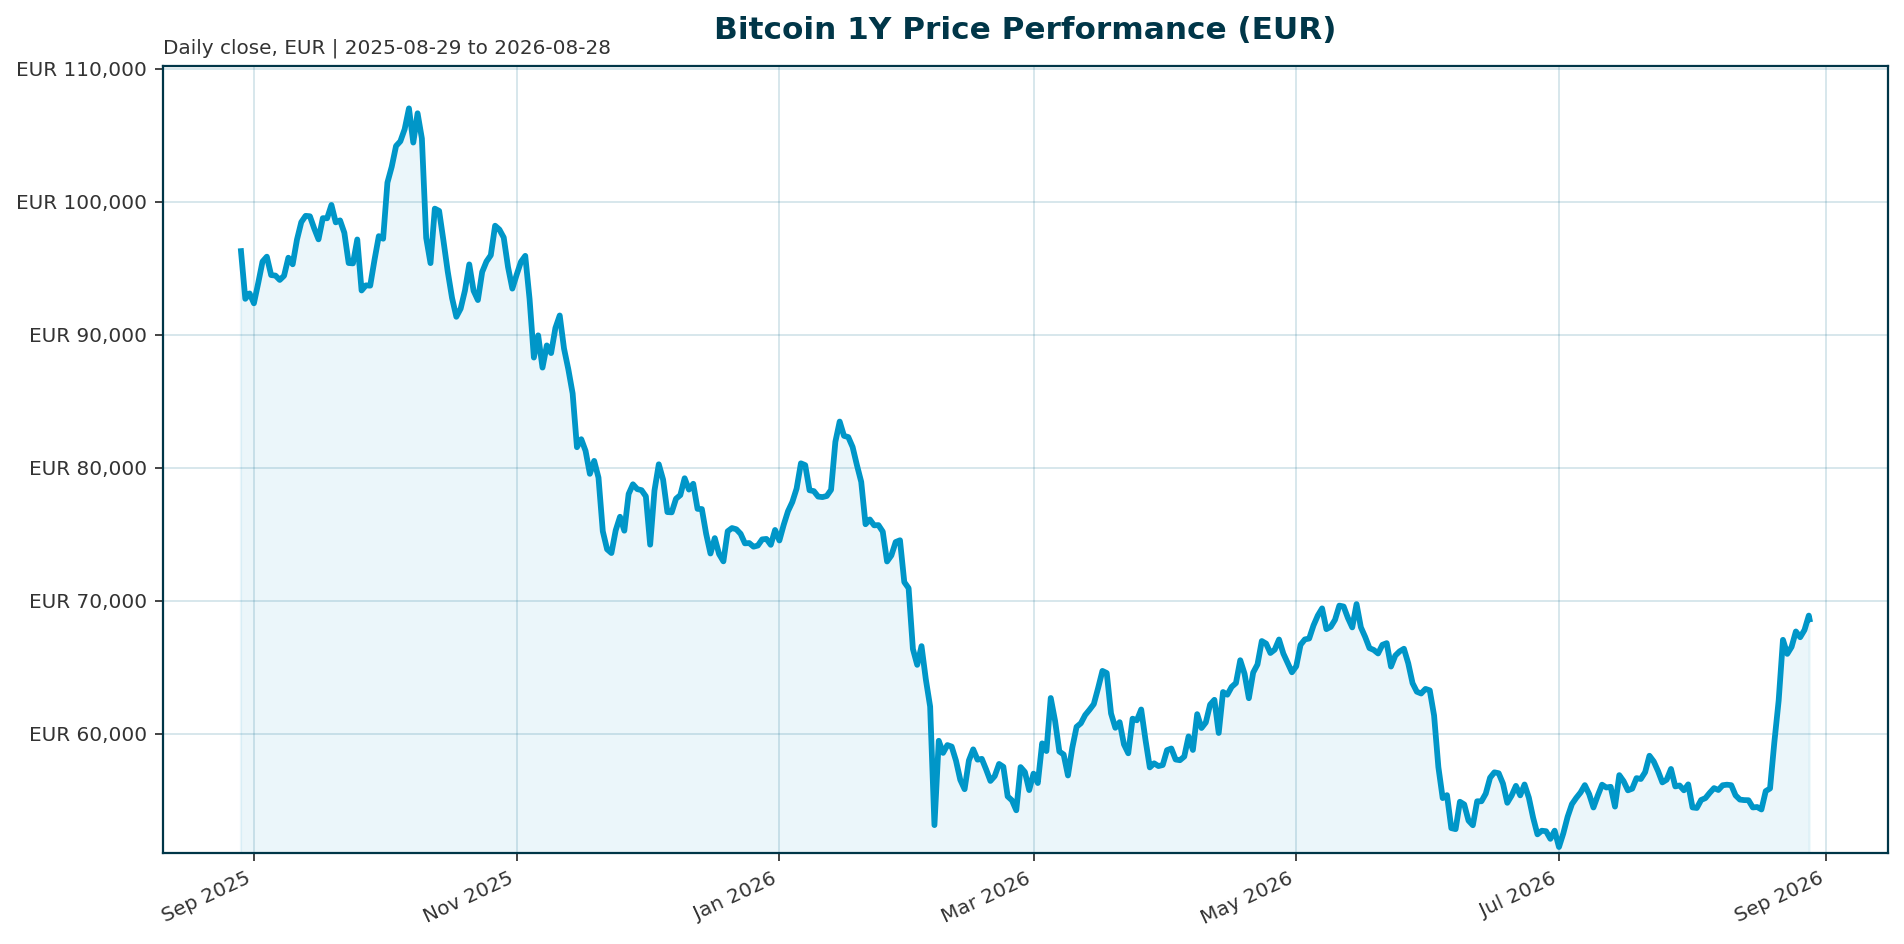
| Metric | Value | Change (24h) | Change (7d) | Change (1y) |
|---|---|---|---|---|
| Price (EUR) | 68,517.00 | +1.30% | +7.30% | -28.40% |
| Market Cap | 1.38 T EUR | +1.42% | N/A | N/A |
| 24h Volume | 31.20 B EUR | N/A | N/A | N/A |
| BTC Dominance | 59.27% | N/A | N/A | N/A |
| All-Time High | 107,662.00 EUR | N/A | N/A | -36.36% |
| 200-Day Return | +13.00% | N/A | N/A | N/A |
Market Setup
Risk sentiment is positive with broadly positive equity momentum, though regional performance is divergent. The euro area 10Y yield is 3.25% with mixed movements, while EUR/USD sits at 1.1655. Key observations include the Nikkei 225 leading on a 1-month basis at 8.54% and the Euro Stoxx 50 being the weakest 5-day performer at -0.09%. DACH equity indicators average 0.78% over 5 days versus 1.11% for global indicators, indicating a localized European lag.Investment Thesis
The core thesis is a paradigm shift from speculative retail markets to a mature, institutionalized asset class. Regulatory clarity via the U.S. BITCOIN Act and EU MiCA has normalized access, while $132.5 billion in ETF inflows signal tectonic capital reallocation [T2]. Bitcoin is evolving into a cornerstone of modern portfolio theory, increasingly viewed as a systemic inflation hedge [T4]. The asset is transitioning from a fringe asset to a strategic store of value, supported by structural demand from corporate treasuries and regulated investment vehicles.Bullish Drivers
Bullish momentum is driven by robust ETF flows and regulatory easing. New SEC rules are streamlining approvals, while the GENIUS Act has normalized Bitcoin as a core holding [T4][T6]. Market participants anticipate continued liquidity expansion following Fed rate cuts, which make high-yield assets like BTC more attractive versus bonds [T7]. Furthermore, the Trump administration’s executive order allowing Bitcoin in 401(k)s unlocked access to an $8.9 trillion capital pool [T4]. Bank of America and Vanguard endorsements further signal growing institutional acceptance [T7].Relative Positioning vs Gold and Ethereum
Bitcoin is positioning as “digital gold,” recently hitting record highs alongside traditional safe havens during inflationary periods [T6]. However, its correlation with gold remains erratic compared to the latter’s historical stability [T5]. Ethereum offers a distinct value proposition through staking rewards of 3% to 4% annually, retaining over 80% of peak institutional inflows despite market drawdowns [T3]. While BTC dominates market cap share at 59.27%, ETH provides a yield-bearing alternative that appeals to income-oriented investors.Scenario Framework
A bullish scenario requires a breakout above ~117,000 EUR to resume the trend, with Standard Chartered targeting year-end levels above 200,000 EUR [T6]. A base case assumes tight range trading between 60,000 and 120,000 EUR. Conversely, a bearish scenario involves a macro shock or recession testing the 60,000 to 80,000 support zone [T6]. Short-term volatility will likely hinge on U.S. macro policy and geopolitical developments.Valuation Discussion
Valuation remains attractive relative to the 2025 All-Time High of 107,662 EUR, representing a 36% discount. With a market cap of 1.38 trillion EUR, Bitcoin is approaching the valuation of traditional safe havens, though it remains significantly smaller than the global gold market cap. The current price action reflects a stabilization phase following the 2025 volatility, with the 200-day return of +13% suggesting a recovery trajectory.Risks
Key risks include regulatory gridlock, as Senate negotiations stall over stablecoin rules, potentially delaying clarity until after the 2026 midterms [T3]. A hawkish pivot in Fed policy or a liquidity squeeze could drag Bitcoin down even if fundamentals remain strong [T1]. Additionally, the persistence of “tourist” investors—short-term speculators—compromises market stability as the institutional base matures [T8].Appendix
Sources
- Bitcoin Adoption And Regulatory Developments Crucial As October Kicks Off – Forbes [T1]
- The Institutional Bitcoin Adoption Wave: A Paradigm Shift in Digital Asset Allocation – AInvest [T2]
- Crypto SWOT: U.S. spot Bitcoin ETFs drew $697 million in inflows on the second trading day of 2026 – KITCO [T3]
- Is Bitcoin’s 12% Pullback a Buying Opportunity or a Warning Sign? – AInvest [T4]
- Debunking Bitcoin Myths: Exploring the Truth Behind the Cryptocurrency’s Role in the Market – AInvest [T5]
- Bitcoin Hits $110K: Bull Run to $200K or a Downward Slide to $80K? Latest Crypto Market Update – ts2.tech [T6]
- Bitcoin Bounces Back As Markets ‘Aggressively’ Front-Run Fed Meeting, Says Analyst – Forbes [T7]
- Bitcoin is struggling again after a brief comeback. Here’s what’s keeping it down. – Business Insider [T8]
This report is AI-generated for informational purposes only and does not constitute investment advice. Users should conduct their own research and consult with a qualified financial advisor before making investment decisions.
Important Note / Wichtiger Hinweis:
EN: This report may have been generated using AI. It processes data from publicly available sources. The content is provided for informational purposes only.DE: Dieser Bericht kann mithilfe von KI erstellt worden sein. Dabei werden Daten aus öffentlich zugänglichen Quellen verarbeitet. Die Inhalte dienen ausschließlich Informationszwecken.
* DE: Die ergänzenden Inhalte können KI-generiert sein. EN: The additional content may be AI-generated.