
Listen to the summary
Key Data Snapshot
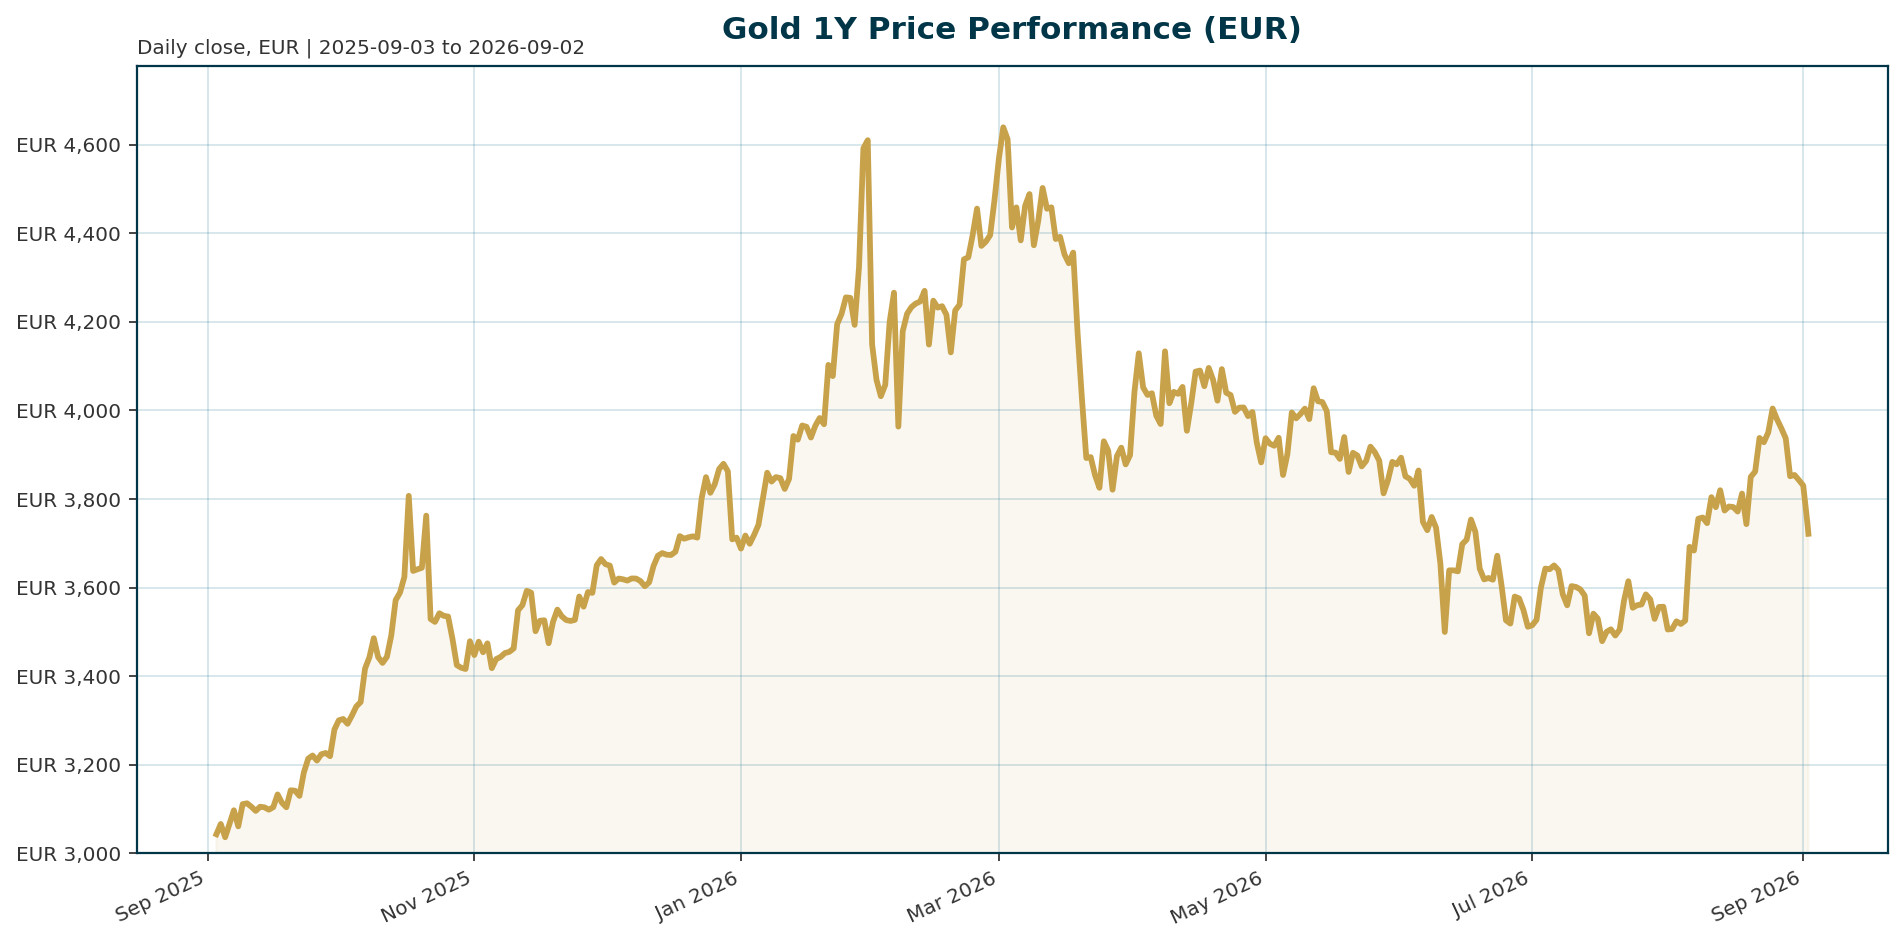
| Metric | Value | Context |
|---|---|---|
| Price (XAU/EUR) | 3,726.46 | Consolidating after Jan 2026 ATH of 4,688.32 (-20.5%) |
| 24h Change | -2.39% | High intraday volatility |
| 7d Change | -7.30% | Correction phase following strong YTD run |
| 1y Change | +22.40% | Significant outperformance vs global equities |
| Real Yields (Est) | ~2.0% | 10y TIPS, historically within accumulation band [T2][T4] |
| Central Bank Avg (4y) | 1,000t | td>Record accumulation vs 500t previous decade [T7]
Macro Backdrop
Risk sentiment is neutral with moderately positive equity momentum in the DACH region. The Euro area AAA 10Y yield is 3.34% with a steepening curve, while EUR/USD sits at 1.1603. Key observations include ATX leading 1-month performance at 4.65% and Nikkei 225 underperforming at -2.68% over five days. The Euro area AAA 10Y-2Y spread is 48.4 bp, indicating a mixed backdrop for the non-yielding asset.Investment Thesis
The investment thesis for Gold centers on the divergence between short-term real yield pressure and long-term structural demand. While elevated real yields and a sticky inflation environment currently weigh on the price [T1][T5], the structural case remains compelling. Gold serves as the ultimate hedge against currency debasement and persistent inflation. The primary argument is that record central bank accumulation will eventually outweigh the opportunity cost of holding a non-yielding asset. As geopolitical and monetary policy uncertainty persists, Gold remains the anchor for reserve diversification, particularly as EMDE institutions prioritize hedging against instability [T3][T7].Bullish Drivers
- Structural Reserve Diversification: Global central banks have accelerated accumulation to an average of 1,000t over the past four years, a significant increase from the 500t average of the preceding decade. Nearly 90% of respondents expect reserves to increase further [T7][T8].
- Real Yield Compression Potential: Current monetary policy suggests real yields will stay compressed for the foreseeable future. Central banks face a difficult balancing act that often results in interest rates failing to keep pace with actual inflation, creating a favorable environment for gold [T4].
- Gold-Silver Ratio Dynamics: The gold-to-silver ratio has narrowed from extreme levels (100:1 in April 2025) to approximately 57:1. This compression suggests silver is leading a catch-up rally, which historically spills over to support gold prices [T4].
- Currency Devaluation Concerns: Persistent inflation and monetary easing expectations support the narrative of fiat currency debasement, reinforcing Gold’s role as a store of value [T3].
Relative Positioning vs Bitcoin and Ethereum
Gold maintains a distinct role as a defensive asset compared to Bitcoin and Ethereum. Gold is negatively correlated with real interest rates and the US Dollar, acting as a hedge against monetary policy shifts and currency debasement. In contrast, Bitcoin and Ethereum are more sensitive to global liquidity conditions and broader risk sentiment. With BTC dominance at 59.1%, Gold remains the primary reserve asset, typically outperforming risk-on assets like crypto during periods of stagflation or economic weakness [T4][T8].Scenario Framework
- Bull Case: The Federal Reserve pivots dovish before inflation is fully controlled, causing real yields to collapse. This would trigger a re-rating of gold, allowing it to reclaim the 4,000 EUR level supported by renewed safe-haven demand and ETF inflows [T1][T6].
- Base Case: Inflation moderates slowly, real yields hold in the 1.5% to 2.0% range, and the US Dollar remains strong. Gold consolidates within a range, supported by central bank buying but capped by higher real yields and a stronger dollar [T2][T5].
- Bear Case: An oil shock drives inflation higher, forcing central banks to maintain or extend tightening cycles. Real yields spike above 2.5%, placing renewed pressure on the non-yielding asset and potentially triggering a deeper correction below 3,500 EUR [T5][T6].
Valuation Discussion
Current prices reflect a 20.5% pullback from the January 2026 ATH, which implies room for recovery if macro headwinds ease. Despite the recent correction, Gold is trading at approximately 3x its 2019 ATL, suggesting the long-term upward trend remains intact. Valuation metrics indicate that real yields at ~2% are historically within the “accumulation band” where gold has thrived, suggesting the asset is not currently expensive relative to its long-term potential [T2][T4].Risks
- Sovereign Reserve Liquidation: A tail risk exists if major sovereigns (US, Germany, Italy) require asset sales to stabilize public finances, creating a supply shock that weakens the structural price floor [T6].
- Higher-for-Longer Rates: If inflation proves more persistent than anticipated, central banks may be forced to keep rates higher for longer, maintaining elevated real yields that suppress gold demand [T1][T5].
- Energy Price Shock: Rising geopolitical tensions have pushed energy prices higher, which can reinforce inflation expectations and complicate the path for monetary easing, acting as a headwind for the safe-haven asset [T5].
Appendix
Sources
- Gold approaches macro inflection as PCE data tests Fed outlook [T1]
- Central Banks Are Snapping Up Gold, ETF Investors Are Just Waking Up [T2]
- Gold looks beyond war as inflation, monetary policy steer prices [T3]
- 7 Reasons Gold and Silver Will Surge From Current Levels [T4]
- Geopolitics alone isn’t enough to lift gold [T5]
- Gold Declined 10% Over Two Weeks on Rising Oil Prices and Interest Rate Pressure [T6]
- Central Bank Gold Purchases Hit 1000t Average [T7]
- Both Gold and Silver Lose Key Support Levels! Has Last Year’s Get-Rich-Quick Myth Finally Ended? [T8]
This report is AI-generated, for informational purposes only, and not investment advice. Please consult a qualified financial advisor before making investment decisions.
Important Note / Wichtiger Hinweis:
EN: This report may have been generated using AI. It processes data from publicly available sources. The content is provided for informational purposes only.DE: Dieser Bericht kann mithilfe von KI erstellt worden sein. Dabei werden Daten aus öffentlich zugänglichen Quellen verarbeitet. Die Inhalte dienen ausschließlich Informationszwecken.
* DE: Die ergänzenden Inhalte können KI-generiert sein. EN: The additional content may be AI-generated.